Why the RSI 70/30 Doesn’t Always Work and What to Do Instead
The 70/30 RSI rule is one of the most popular signals in trading but it often leads beginners astray. This guide explains why static RSI levels don’t always work, when they do, and how to read RSI the smart way with trend filters, divergence, and price action confirmation.
If you’ve used the Relative Strength Index (RSI) before, you’ve probably heard the standard rule: over 70 is overbought, and under 30 is oversold. Many beginner traders rely on this simple guideline to make quick buy and sell decisions. But here’s the truth, those levels don’t always work. In fact, blindly following the 70/30 rule can lead to early exits, false signals, or missed opportunities.
In this article, we’ll break down why RSI 70/30 levels aren’t a magic formula, when they fail, and what smarter traders do instead to use RSI effectively.
Key Takeaways
- RSI doesn’t always reverse at 70 or 30, especially in strong trends.
- Market structure, trend direction, and momentum all influence how RSI behaves.
- Using dynamic RSI levels, confluence tools, or price action can improve your timing.
- RSI is best used as part of a bigger system, not in isolation.
The Problem with Static RSI Levels
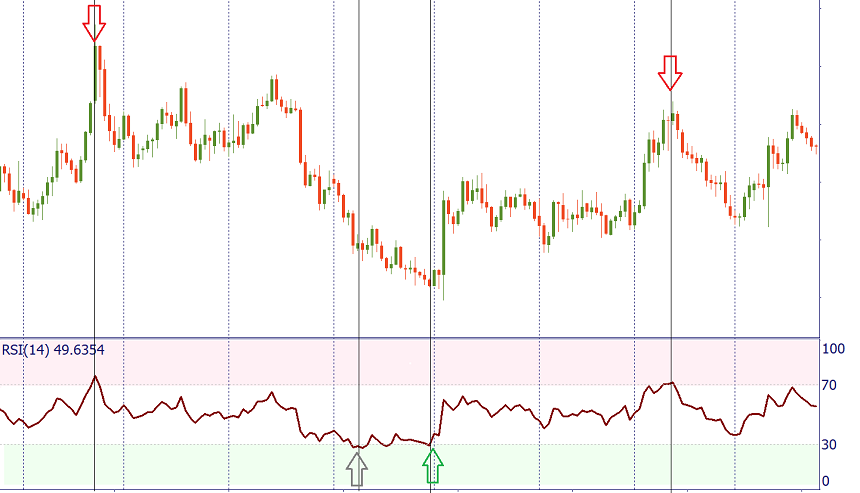
The 70/30 idea sounds great in theory: when price is too high (overbought), it should fall. When it’s too low (oversold), it should rise. But the market isn’t that simple.
In trending markets, RSI can stay above 70 or below 30 for a long time. Price may keep rising even when RSI is screaming overbought, and it may keep falling even when it looks oversold. This confuses many traders who enter too early or exit too soon.
Example: In a strong uptrend, RSI might push above 70 and hover around 75-85 for hours or even days. If you sell just because it hit 70, you might miss the rest of the move.
When RSI 70/30 Works Best
While RSI’s 70/30 rule can be unreliable in trending markets, it still serves a valuable purpose, particularly in ranging or sideways markets. These are conditions where price moves back and forth between established support and resistance levels without forming a clear trend. In this environment, RSI's overbought and oversold signals are more dependable.
Ranging Market Conditions
In a range-bound market, price tends to “bounce” from support to resistance repeatedly. There’s no strong upward or downward bias, just horizontal movement. RSI performs well here because momentum naturally slows at the edges of the range, allowing for cleaner reversal signals.
Example:
Let’s say EUR/USD has been stuck between 1.0800 and 1.1000 for days. When price approaches 1.1000 and RSI hits 70, it’s often a sign of temporary exhaustion, suggesting a pullback or reversal. The same logic applies at the bottom of the range, RSI near 30 while price sits on support could signal a rebound.
Confluence with Support and Resistance
RSI signals become stronger when they align with clear support and resistance levels. When RSI hits 70 and price also taps into a historical resistance zone, the likelihood of a reversal increases. This confluence of technical evidence makes the trade setup more reliable.
Tip:
Use horizontal lines or price action zones to map your support/resistance. Then wait for RSI to confirm that price is stretching too far in that zone.
Short-Term Scalping Opportunities
In low-volatility sessions or consolidating periods, traders who scalp (take quick trades for small profits) can use RSI 70/30 for fast in-and-out trades. Since price isn’t trending, reversals off these levels tend to be sharp but short-lived which is perfect for scalping with tight stop losses.
Scalping Tip:
Use the 5-minute or 15-minute RSI chart with price zones from a higher timeframe (1H or 4H) for precision entries
Candle Confirmation Adds Strength
Even in a ranging market, don’t rely on RSI alone. Wait for a candle pattern like a doji, pin bar, or engulfing candle at the RSI extreme to confirm that price is rejecting the level. This helps filter out false moves and improves entry timing.
Example:
If RSI hits 30 and price is sitting at support, wait for a bullish pin bar or engulfing candle before entering long.

How to Improve RSI Accuracy
RSI is a powerful tool but only when used intelligently and in context. Blindly following its basic signals can lead to premature trades, but combining RSI with other techniques makes it far more effective. Here’s how to get more accurate readings and better entries from your RSI setups:
Use RSI with Trend Direction
One of the biggest mistakes new traders make is trading RSI signals against the trend. Just because RSI is overbought doesn't mean price will fall, especially in an uptrend. Likewise, in a downtrend, RSI being oversold doesn’t guarantee a bounce.
Instead, align RSI with trend momentum:
- In uptrends, RSI pullbacks to the 40–50 zone are usually healthy corrections and often mark buying opportunities before the next leg up.
- In downtrends, watch for RSI to stall around 50–60 before resuming the move lower. This zone acts like a ceiling for momentum in bearish conditions.
Using trend-based RSI zones as support or resistance for momentum gives you a clearer read than default 70/30 signals alone.
Pro Tip:
Pair RSI with a trend indicator like the 200 EMA to help confirm trend direction before acting.
Combine RSI with Price Action
RSI becomes much more reliable when it agrees with price action. If RSI reaches an extreme level and price also forms a recognizable candlestick pattern, that’s a higher-probability setup.
Look for patterns such as:
- Pin bars or doji candles at RSI extremes (signals exhaustion)
- Engulfing candles confirming reversals from support/resistance
- Double tops/bottoms where price fails to continue despite momentum readings
Example:
RSI hits 70 while price is at a resistance zone and prints a bearish engulfing candle. That’s stronger confirmation of a possible reversal than RSI alone.
Why it works:
You’re combining momentum exhaustion (RSI) with a visible shift in price behavior (candle structure).
Adjust RSI Settings
The default RSI period of 14 is popular, but it’s not universal. Customizing your RSI length can help tailor it to your trading strategy and timeframe.
- Use a shorter period (e.g., RSI 5 or 7) if you’re a scalper or short-term day trader. It reacts quickly to small price changes and gives more signals—but also more noise.
- Use a longer period (e.g., RSI 21 or 30) if you prefer swing trading or want cleaner signals. It smooths out the noise and highlights only the strongest trends.
How to choose:
Test both settings in backtesting or demo trading to see which version gives you cleaner setups for your style.
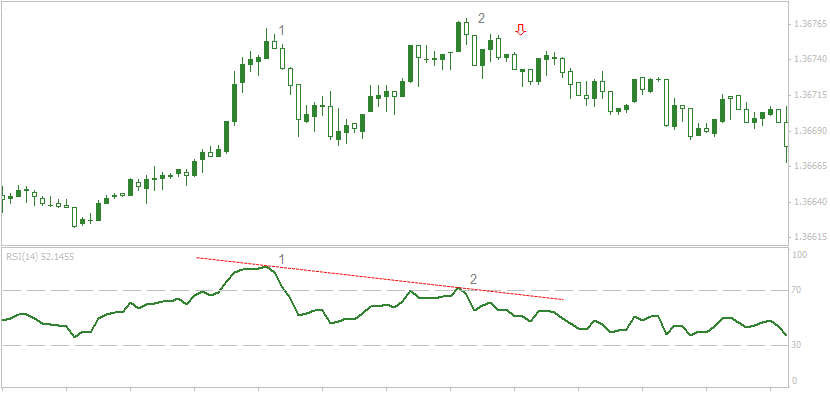
Spot RSI Divergence
Divergence is when price moves in one direction but RSI moves in the opposite. This is a powerful signal that momentum is fading and a reversal may be coming.
There are two main types:
Regular Divergence:
Bullish: Price makes a lower low, but RSI makes a higher low → potential reversal up.
Bearish: Price makes a higher high, but RSI makes a lower high → potential reversal down.
Hidden Divergence:
Bullish: Price makes a higher low, but RSI makes a lower low → continuation of an uptrend.
Bearish: Price makes a lower high, but RSI makes a higher high → continuation of a downtrend.
Why divergence matters:
It highlights where price might be deceptively strong or weak which is a clue that smart money may be stepping in before a move.
Best practice:
Always look for divergence near support/resistance zones, trendlines, or after major breakouts or stop hunts for best results.
Static RSI vs Smart RSI Use
|
Approach |
Description |
Risk |
Best Market Type |
|
RSI 70/30 Only |
Buy below 30, sell above 70 |
Many false signals |
Ranging |
|
RSI + Trend Filter |
Use RSI
pullbacks within trend |
More reliable |
Trending |
|
RSI + Price
Action |
Look for candle signals at RSI extremes |
Clearer confirmation |
Any |
|
RSI + Divergence |
Watch for
divergence at key levels |
Good reversal
signals |
Reversal
setups |
|
RSI with Custom
Levels |
Adjust to 80/20 or 60/40 based on context |
Flexible but needs testing |
Any |
Smarter RSI Settings for 2025 Markets
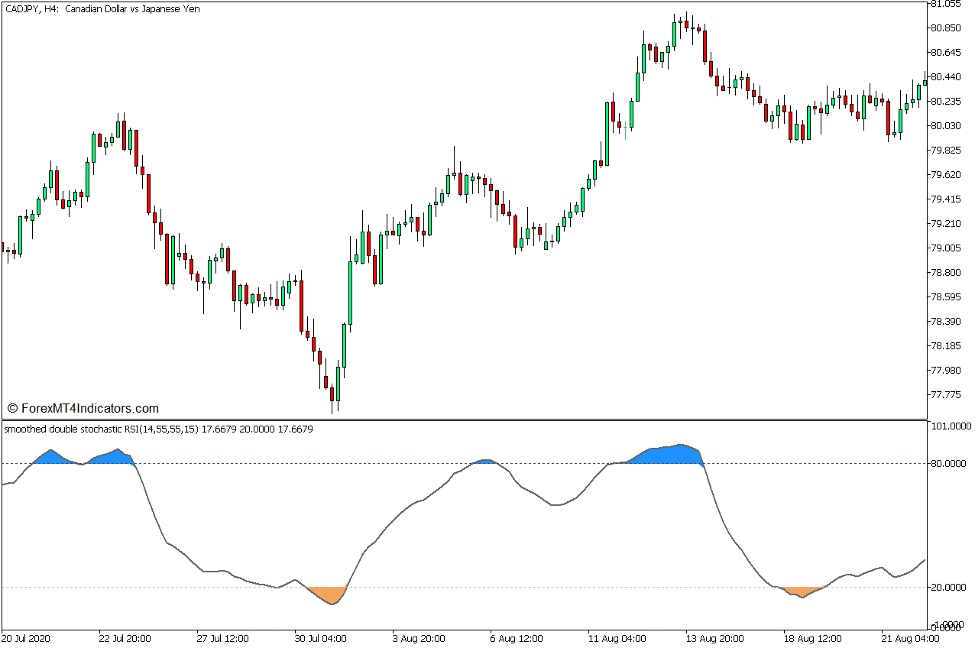
In fast-moving markets like crypto or high-volatility forex pairs, RSI needs to be handled carefully. Try these smart tweaks:
- Use 80/20 instead of 70/30 in strong trends. This filters out false signals.
- Use RSI 14 for swing trading, RSI 5-7 for scalping.
- Combine RSI zones with Fibonacci levels for extra confluence.
Also, pay attention to volume. If RSI hits 70 on low volume, the signal is weak. If it happens with a volume spike, it’s more likely to matter.
Conclusion
RSI is a great tool, but it’s not a cheat code. The 70/30 rule can be helpful, but only in the right context. Traders who rely on RSI alone often get trapped by false signals or trend continuation moves. Instead, treat RSI like a lens. It gives you insight into strength and weakness, but it’s up to you to read the full chart. Combine RSI with price action, structure, and confirmation to trade smarter. Let the market tell you when it’s ready, not the indicator alone.
Frequently Asked Questions (FAQs)
1. Is RSI 70/30 still valid in 2025?
It can work in ranges, but it’s less effective in trending markets. Use it with context.
2. What are better RSI levels for trending markets?
Try 80/20 or use RSI pullbacks to 40 (in uptrends) or 60 (in downtrends).
3. How do I confirm RSI signals?
Use price action, volume, trendlines, or chart patterns for confirmation.
4. Is it okay to change the RSI settings?
Yes. Many traders adjust RSI period length to better suit their timeframes.
5. Can RSI be used with other indicators?
Absolutely. It works well with moving averages, MACD, Bollinger Bands, and support/resistance zones.