Why ATR Doesn’t Predict Direction (And Why That’s a Good Thing)
ATR doesn’t tell you where price is going. It tells you how much it moves. In this guide, we explain why ATR’s lack of direction is its biggest strength and how you can use it to trade smarter.

"Risk comes from not knowing what you're doing." – Warren Buffett
The Average True Range (ATR) is a helpful trading tool, but many new traders think it tells you where price will go next. That’s not true. ATR doesn’t show if price will go up or down, it only shows how much price is moving. And believe it or not, that’s a good thing. In this article, you’ll learn why ATR doesn’t predict direction, why that’s useful, and how to make it work for you in forex trading.
Key Takeaways
- ATR measures volatility, not price direction.
- Not predicting trends helps ATR stay neutral and reliable.
- Traders use ATR to size stop-losses and identify quiet or wild market conditions.
- Pairing ATR with trend tools creates better entry and exit setups.
- ATR keeps your trades based on real movement, not guesses.
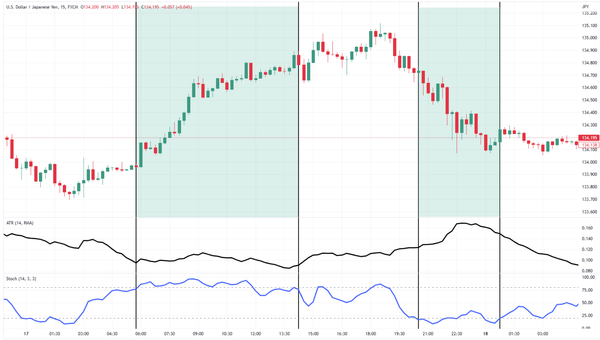
What ATR Actually Measures
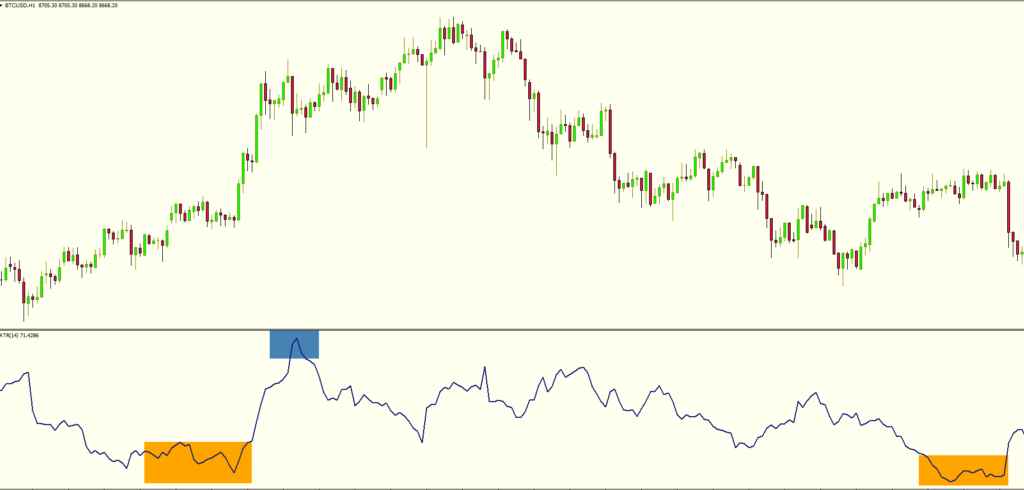
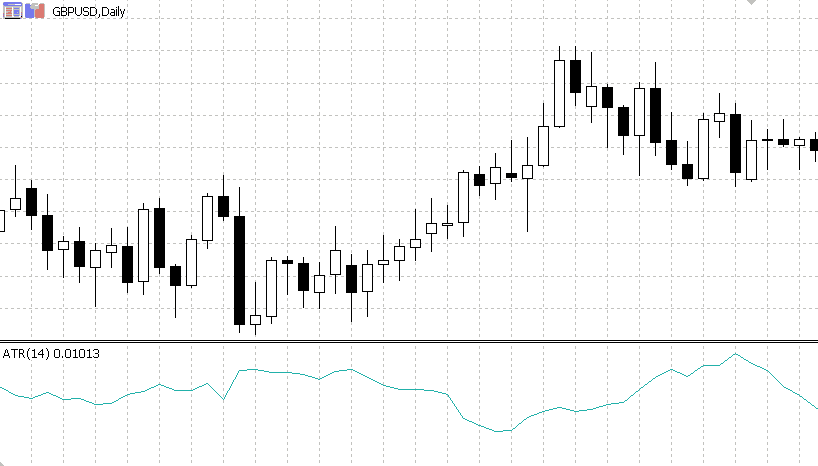
ATR shows how much a currency pair moves over a set number of candles (usually 14). It tracks the size of the candles, not whether they’re going up or down. Think of it like measuring how far a car moves, without caring if it’s going forward or backward. That’s what ATR does, it shows you how much movement is happening, not which direction it’s going.
Because ATR doesn’t pick a side, it works in any kind of market. It tells you, “The market is active,” or “The market is quiet,” and lets you decide what to do with that information.
Why Not Predicting Direction Is a Strength
Most beginner traders expect every tool to tell them where price will go next. But ATR doesn’t do that and that’s actually a good thing. ATR is not about guessing the future. It’s about understanding how far price might move. Let’s break down why this “neutral” approach is powerful.
It Keeps You Focused on What You Can Control
You can't control which way the market moves. No indicator can tell you for sure whether price will go up or down. But ATR helps you stay focused on what you can manage like your stop-loss size, your risk per trade, and your trade timing. By showing how much price typically moves, ATR lets you build trades around reality, not prediction.
It Works in Every Market Condition
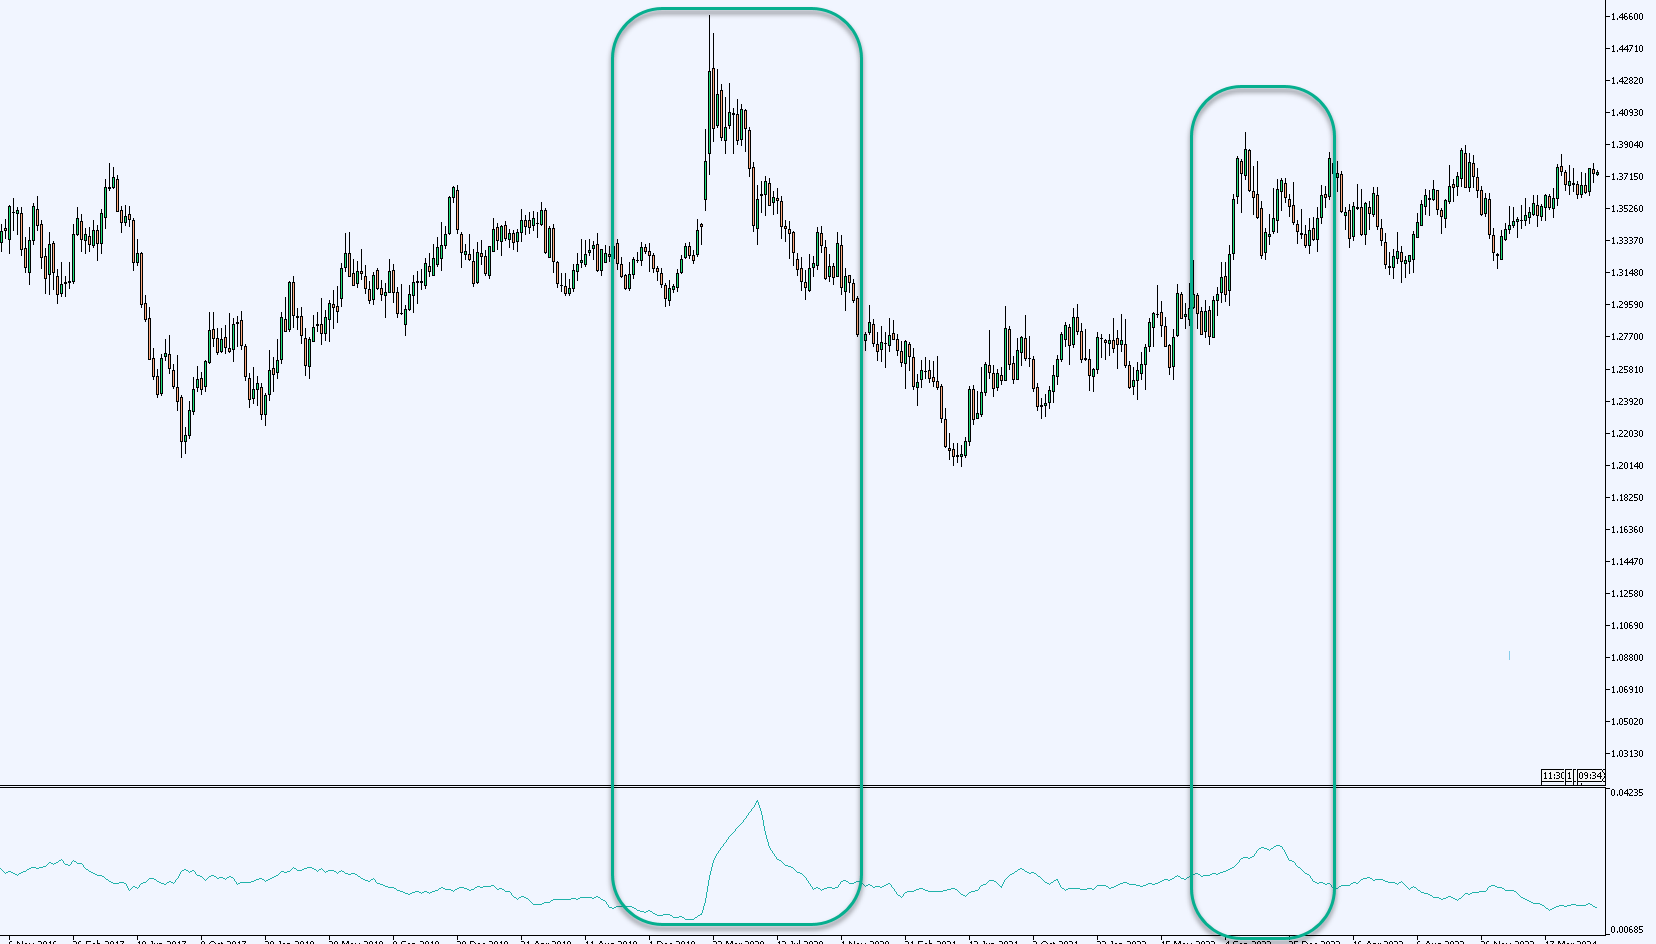
Trending or ranging, bullish or bearish, ATR stays useful. Since it doesn’t rely on price direction, it adjusts to whatever the market is doing. If the market becomes more volatile, ATR rises. If it gets quiet, ATR drops. This makes it a consistent tool across all kinds of market behavior.
It Helps You Adapt to Real-Time Volatility
Imagine two trades that look the same on the chart, but one happens during a news release and the other during a calm session. ATR shows you the difference. If the ATR is high, you know there’s a lot of movement, so you can widen your stop-loss or reduce your position size. That flexibility comes from not needing to know which direction the market will go.
It Makes Other Tools More Reliable
When you pair ATR with trend indicators or price action tools, it becomes even more powerful. For example, if your strategy says buy, but ATR is very low, it might be a bad time to enter. On the other hand, if ATR is high and volume is rising, your setup might have more potential. ATR acts like a filter that improves your decision-making, without interfering with your strategy.
How Traders Use Directionless ATR in Real Setups
Even though ATR doesn’t show direction, traders still use it every day to build strong trade plans. Its true power shows up when it’s used alongside other tools like price action, trend lines, or chart patterns. Here's how traders actually use ATR to make better decisions, step by step.
Sizing Positions Based on Volatility
One of the main uses of ATR is helping traders decide how big or small their trade should be. When ATR is high, the market is moving fast. That means more risk so traders usually lower their position size to stay safe. When ATR is low, the market is calm, so they can take a slightly bigger position without overexposing themselves.
Example: If ATR is 50 pips and your account can risk 100 pips total, you might trade two mini lots. But if ATR jumps to 100 pips, you might only trade one lot to keep your risk the same.
Setting Smarter Stop-Losses
ATR helps traders avoid placing their stop-loss too close to the entry. A stop that’s too tight in a high-volatility market might get hit quickly, even if the trade idea was good. By using ATR, traders adjust their stop-loss based on how far price usually moves.
Example: If ATR is 20 pips, you might use a stop-loss of 1.5x ATR = 30 pips. This gives the trade more breathing room and avoids getting stopped out by random market noise.
Avoiding Low-Volatility Traps
Markets sometimes “sleep” and barely move. These periods often trap new traders into entering trades that go nowhere. ATR helps you spot these times. If ATR is very low, it’s a sign the market isn’t moving much, so it might be better to wait until things heat up.
Real-World Tip: Many traders skip trades when ATR is below a certain level (like 10 pips on EUR/USD), knowing there’s not enough movement to make a good profit.
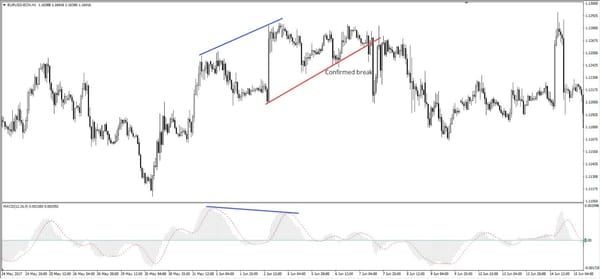
Timing Trade Entries
Some traders wait for a rise in ATR before entering a trade. Why? Because growing volatility often means a bigger move is coming. A jump in ATR can confirm that the market is waking up, and that the trade idea has room to run.
Example: If you spot a breakout from a support level and ATR starts rising, it adds confidence that the move is real, not just a fakeout.
Adjusting Take-Profit Targets
Just like ATR helps with stop-losses, it also helps with setting take-profit levels. If the market is volatile (high ATR), traders aim for larger profits. If the market is quiet, they aim smaller. This keeps reward-to-risk balanced.
Example: If ATR is 40 pips, a trader might aim for 80 pips profit (2x ATR). But if ATR is only 10 pips, they might go for a smaller 20 pip gain to avoid overreaching.
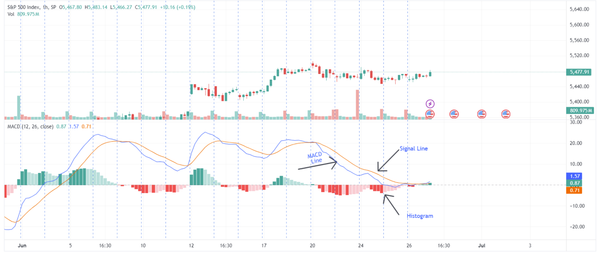
Predictive Tools vs ATR
|
Feature |
Predictive Indicator (e.g., MACD) |
ATR (Volatility Tool) |
|
Tells you direction? |
Yes |
No |
|
Works well in sideways markets? |
Sometimes |
Yes |
|
Helps set stop-loss? |
Not really |
Yes |
|
Confirms market activity? |
Not always |
Yes |
|
Needs trend to function? |
Yes |
No |
Pairing ATR With Other Indicators
ATR is most powerful when used with tools that show trend direction. On its own, it helps manage risk. With trend indicators, it helps you time entries and exits better.
For example, if a moving average shows an uptrend and ATR is rising, that’s a strong setup. The trend is up, and the market has good momentum.
You can also pair ATR with RSI, MACD, or support/resistance levels to get clearer signals. ATR won’t tell you where to go, but it can tell you how fast things are moving once you do.
Conclusion
ATR doesn’t predict price direction and that’s not a weakness. It’s a superpower. By focusing only on how much the market is moving, ATR keeps your trading plan clean and logical. It helps you manage risk, stay out of trouble, and make better decisions based on real movement, not wishful thinking.
So next time you’re tempted to look for the next big move, let ATR handle the how much, while your strategy handles the which way.
FAQs
1. Can I use ATR to find trade entries?
ATR doesn’t give entry signals directly, but it can help confirm when the market is active enough to trade. Combine it with trend or price action tools for better results.
2. What is a good ATR value in forex?
It depends on the pair and timeframe. For example, a 14-period ATR of 0.0050 on EUR/USD means a 50-pip average range, which is fairly active.
3. Should I change the ATR period?
Most traders use the default 14-period. But shorter periods give quicker signals, while longer ones smooth things out. Test what works for your style.
4. Is ATR better than RSI or MACD?
They’re different. ATR shows volatility. RSI and MACD show momentum and trend. They work best when used together.
5. Does ATR work in all markets?
Yes! ATR works in forex, stocks, crypto, anywhere you want to measure volatility.