What Is Relative Volume (RVOL)? How to Use It to Find Powerful Trade Setups
RVOL (Relative Volume) shows you how active a stock is compared to its usual activity. Learn how to use it to spot breakout setups, momentum trades, and avoid dead stocks.

What Is Relative Volume (RVOL)?
Relative Volume (RVOL) is one of the most important indicators for short-term and momentum traders. It tells you how current trading volume compares to average volume over a specific time frame.
Put simply:
RVOL = Current Volume / Average Volume
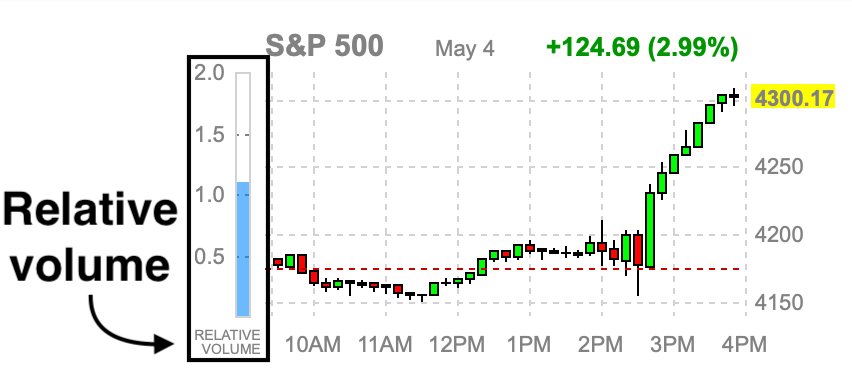
An RVOL of 1.0 means the stock is trading at its normal volume. An RVOL of 2.0 means the stock is trading twice its normal volume. An RVOL of 0.5 means the stock is trading half its usual volume.
Why Relative Volume Matters to Traders
Most successful traders rely on volume to confirm setups, validate breakouts, and stay away from dead stocks.
Here’s why RVOL is critical:
- ✅ High RVOL means momentum. A stock with 3x its average volume is being traded heavily. That often means a catalyst is in play (news, earnings, breakout, short squeeze).
- ❌ Low RVOL means low interest. If volume is dead, price action will likely chop sideways. Most traders avoid these setups.
- 🔍 RVOL helps filter the noise. It shows you which stocks are "in play" today versus ones that are just drifting.
Ideal RVOL for Intraday Trading
- Day trading: Look for RVOL of 2.0 or higher for potential breakout setups.
- Momentum plays: RVOL above 3.0 can signal massive crowd interest and emotional price action.
- Swing trading: RVOL above 1.5 helps validate breakouts or breakdowns from key levels.
If you're scanning for opportunity, start by filtering stocks by RVOL > 2.0.
How to Use RVOL in Your Trading Strategy
1. Confirming Breakouts
If a stock breaks a key resistance level but RVOL is only 0.9 — that's a red flag. If the same stock breaks with RVOL 3.5 — it’s likely legit.
2. Avoiding Traps
Stocks with RVOL below 1.0 often fake out. Low volume = low conviction. If you’re unsure about a setup, check RVOL.
3. Spotting Early Momentum
Some stocks spike in volume before the price even reacts. RVOL rising early in the day — before a breakout — can be your signal to watch it closely.
4. Identifying Dead Stocks
If RVOL is below 0.5 — there’s no juice. Skip it. Low RVOL = No interest = No edge.
How to Find RVOL
Most platforms display RVOL in their scanners or chart tools. Here are a few ways:
- TradingView: Add "Relative Volume" from the indicators tab.
- ThinkorSwim / TD Ameritrade: Custom column: RVOL (5-day avg)
- Benzinga / Finviz: Use RVOL filters in stock screener.
- Discord Alert Bots: Some trading bots will include RVOL in their trade alerts.
Note: Not every platform calls it "RVOL." You may see "Rel Vol" or "Volume Ratio."
RVOL Combined with Other Indicators
RVOL is strongest when used with other tools:
- RVOL + VWAP reclaim: Great for intraday long setups.
- RVOL + RSI breakout: Signals strength + momentum.
- RVOL + EMA cross: Confirms trend shift with strong participation.
Internal Links
- New to trading? Read our Beginner’s Guide to Stock Trading.
- Want to understand chart patterns better? Check out How to Read Stock Charts.
- Learn to master Stop Loss Strategies.
External Reference
Final Thoughts: Make RVOL Part of Your Daily Scan
Don’t trade in the dark. Volume tells the truth. RVOL is your tool to know which stocks are moving — and which aren’t worth your time.
Whether you’re scalping breakouts or hunting swing entries, RVOL helps you trade with better timing, better conviction, and better results.
Start using RVOL today and stop trading random stocks. Trade what matters.
Ready to Get Better Setups?