What Is ATR in Forex? The Easiest Way to Measure Market Volatility
ATR stands for Average True Range, and it’s one of the best tools for measuring how much a currency pair moves. In this article, you’ll learn what ATR is, how it works in forex, and how traders use it to manage risk, avoid tight stop-losses, and read market conditions better.
“Volatility is the heartbeat of the market. Learn to feel it, and you'll trade with confidence.” — Linda Bradford Raschke
Average True Range (ATR) is a simple tool that tells you how much a forex pair usually moves. It helps traders see if the market is calm or wild. This makes it easier to place stop-losses, set targets, and avoid bad entries.
Key Takeaways
- ATR measures how much price moves, higher ATR means more volatility.
- It doesn’t predict direction, just movement size.
- Perfect for planning stop-loss and take-profit levels.
- Works best when combined with other tools like support/resistance or trend indicators.
- Helps avoid trading during flat or dead markets.
What Does ATR Really Do?
ATR (Average True Range) is like a ruler for price movement. It shows how much a forex pair moves on average during a certain time. For example, if EUR/USD has an ATR of 50 pips on the 1-hour chart, it means it usually moves around 50 pips in one hour.
But ATR doesn’t tell you if price will go up or down. It only says how much price might move. That’s why traders use it for risk control, not for picking direction.
Why Is ATR Useful in Forex?
ATR is one of the most helpful tools for forex traders because it shows how much the market moves. This is super important when you're trying to manage risk and stay out of bad trades. Let’s break down exactly why ATR matters and how it helps with smart decision-making.
Helps You Avoid Stop-Loss Mistakes
Many new traders place their stop-loss too close to their entry point. When this happens, normal price movements can knock you out of a trade even if your idea was right.
How ATR helps:
Let’s say ATR is 40 pips on EUR/USD, but your stop is only 10 pips. That’s too tight. The price often moves more than 10 pips just in normal conditions. ATR shows you how wide your stop should be. A good rule is to set stops about 1 to 1.5 times the ATR.
Result: Your stop-loss is placed where the market is less likely to reach unless the trade truly goes wrong.
Tells You When to Avoid the Market
Sometimes the market is just sleepy. No big moves. No volume. Just sideways chop. ATR helps spot these times.
When ATR is low:
It means price is barely moving. In these quiet times, breakouts often fail. You might enter a trade expecting a big move but nothing happens. You wait and lose time or even money.
How to use it:
If ATR is falling and price is inside a tight range, maybe it’s not the best time to trade. Wait for ATR to rise again before taking a setup. That means the market has woken up and real movement might begin.
Helps with Position Sizing and Risk Management
Smart traders don’t risk the same amount in every trade. They adjust their position size based on how volatile the market is. ATR makes that easy.
Why this matters:
If volatility is high (big ATR), price could swing a lot. That means you should trade smaller to avoid risking too much. If volatility is low (small ATR), your position can be a little bigger because the market is calmer.
Example:
If ATR is 80 pips, you might use a smaller lot size. If ATR drops to 30 pips, you could increase your size slightly but always keeping your risk level steady.
Helps Filter Fake Breakouts
Have you ever seen price break above resistance and then fall right back? That’s a fakeout.
What ATR tells you:
If ATR is low during the breakout, the move might not be strong. But if ATR is rising during the breakout, that means buyers (or sellers) are stepping in with real momentum.
Use it like this:
Only trust a breakout when ATR is rising. That confirms that volatility is entering the market. It can save you from entering bad breakouts too early.
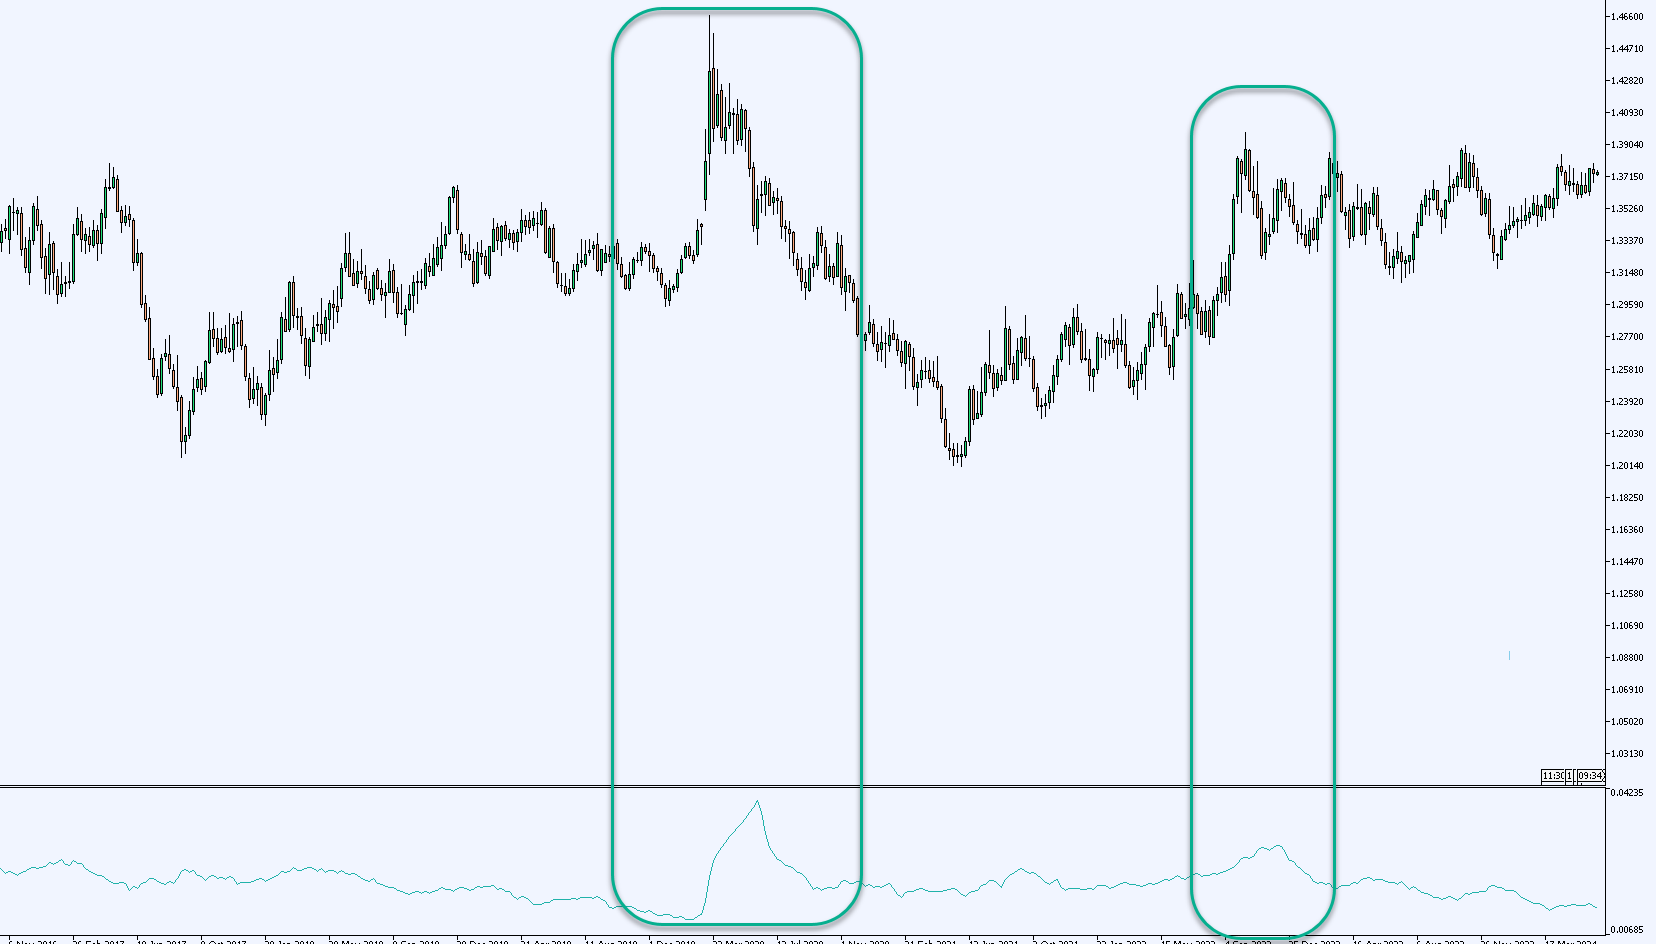
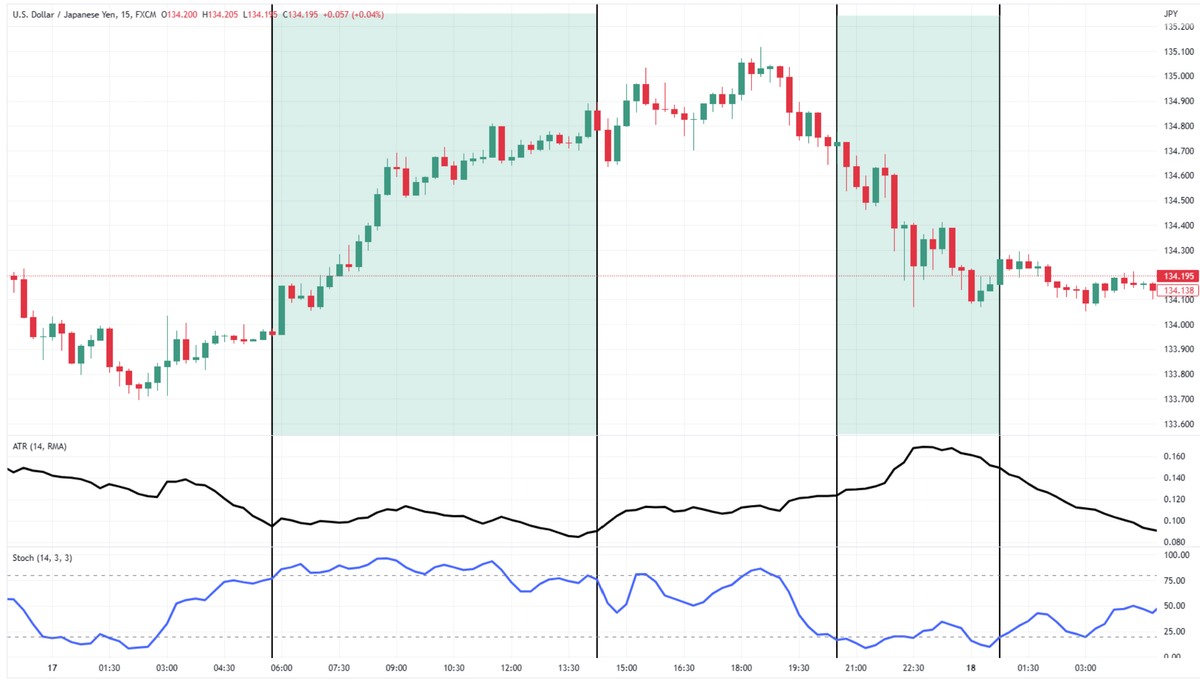
How to Read ATR on a Chart
The ATR line appears below your main price chart.
- If the line goes up, the market is becoming more volatile.
- If the line goes down, the market is calming down.
Use this to adjust your stop-loss and know when breakouts might be real or fake.
When to Use ATR in Trading
Knowing when to use the Average True Range (ATR) can make a big difference in your trading decisions. ATR is not something you turn on once and forget. It becomes most powerful when used at the right moments in your trade planning. Let’s break down the key times ATR can really help you.
Before You Enter a Trade
One of the best times to look at ATR is before you enter any position. By checking the current ATR value, you get a snapshot of how much the market has been moving. This helps you set realistic expectations. If the ATR is high, it tells you that the market is very active, and price might move a lot. That means your stop-loss needs to be wider, and you shouldn’t aim for tiny profits in such a fast environment. On the other hand, if ATR is low, the market is calm, so smaller price targets and tighter stops may be more suitable.
This is especially helpful for swing and intraday traders. For instance, if EUR/USD has an ATR of 100 pips on the daily chart, and you’re looking for a trade that only expects a 30-pip move, that’s well within range. But if the ATR is just 25 pips and you’re aiming for 100, the odds may be against you. ATR gives you context.
During High-Impact News or Volatility Events
ATR becomes very valuable during big market events like interest rate announcements, inflation data releases, or geopolitical news. During these moments, the market can move wildly, and ATR will spike. These spikes are not just numbers—they’re warnings. A rising ATR before or during news events tells you that things are getting risky. In this case, ATR can help you stay out of the market or trade smaller until the dust settles.
For traders who thrive in volatility, ATR spikes can be a signal to get ready. It’s like the market is heating up, and opportunities are coming. But for others, it can be a sign to wait and protect your capital.
When Markets Change Behavior
Markets don’t always behave the same. Sometimes they trend strongly, and other times they move sideways. ATR helps detect these changes. For example, if ATR has been falling for a few days, that means the market is losing energy. This can happen when a strong trend starts to fade, or before a breakout.
If you notice ATR dropping during a trend, it could be a signal that the trend is getting tired and may pause or reverse. If ATR suddenly starts to rise after a quiet period, that could mean a new trend is starting. In both cases, ATR acts as a guide. It helps you adjust your trading style—whether that means holding longer or taking profits sooner.
Where to Place Stops and Targets
|
Strategy |
ATR
Use |
Why
It Helps |
|
Breakout
Trading |
Confirm
with rising ATR |
Shows
strength behind the move |
|
Range
Trading |
Avoid low
ATR zones |
Helps
skip false signals |
|
Stop-Loss
Placement |
Use
1–1.5x ATR from entry |
Keeps
stops from being too tight |
|
Take-Profit
Setting |
Target
1–2x ATR based on setup |
Matches expectations
with movement |
|
Position
Sizing |
Use ATR
to adjust lot size |
Controls
risk when markets are wild |
Combining ATR With Other Tools
ATR is more powerful when used with things like:
- Support and resistance: Use ATR to check if price can break through.
- Trend indicators: If a trend starts and ATR rises, it’s a stronger signal.
- Candlestick patterns: Use ATR to filter fake setups that happen in low-volatility zones.

Conclusion
ATR may look simple, but it’s one of the most useful tools in forex. It helps you know when to enter, how far price might go, and when to stay out. When paired with good chart reading and risk control, ATR becomes your silent trading partner.
FAQs
1. What does a high ATR mean?
It means the market is volatile and price is moving a lot.
2. Can ATR be used for entry signals?
Not directly. ATR shows volatility, not direction. But rising ATR can confirm strength during breakouts.
3. What’s the best ATR setting for forex?
The default is 14, but you can test shorter (7) or longer (21) depending on your strategy.
4. Is ATR better for day trading or swing trading?
It works for both. Day traders use it for quick adjustments; swing traders use it to size positions.
5. How is ATR different from volume?
ATR measures price movement. Volume measures how many trades happened. You can use both for better signals.