The 3 Candle Patterns Every New Trader Should Master
Want to improve your chart reading skills fast? This guide breaks down the 3 most important candle patterns for beginners and shows you how to trade them with confidence.

When you start learning how to trade, charts can feel confusing. But one of the best ways to understand price action is by learning simple candlestick patterns. Candlesticks tell a story about who is in control of the market, buyers or sellers. In this article, we’ll look at three of the most useful candle patterns that every beginner should learn. These patterns are easy to spot, work in many markets, and help you make better entry and exit decisions.
Key Takeaways
- Candle patterns show how price behaves in real time.
- Understanding just a few key patterns can improve your trading.
- These patterns work in all markets: forex, crypto, stocks, and more.
- Always use candle patterns with structure and confirmation, not alone.
- Clear candles = clearer trades.

1. The Engulfing Candle
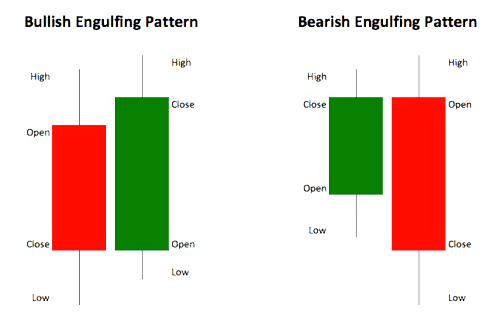
The engulfing candle is one of the most powerful and popular candlestick patterns, especially for spotting potential reversals. It forms when a single candle fully “engulfs” the previous candle’s body. This pattern represents a sudden shift in momentum when one side of the market (buyers or sellers) quickly takes control from the other.
There are two types of engulfing candles:
- Bullish Engulfing: Appears after a downtrend. A large green (bullish) candle completely covers the body of the small red candle before it. This signals that buyers have stepped in strongly, potentially marking the end of the down move and the start of an uptrend.
- Bearish Engulfing: Appears after an uptrend. A large red (bearish) candle fully covers the body of the previous green candle. It shows that sellers have overpowered the buyers, often leading to a downward move.
Why It Matters
The engulfing candle works well because it shows strength and commitment from the winning side. It’s not just about the size of the candle. It’s the fact that price moved in one direction, reversed completely, and closed beyond the previous range. This kind of move traps traders who were on the wrong side and creates momentum in the new direction.
Best Places to Use It
The engulfing pattern is most effective when it occurs:
- At support or resistance levels
- After a fake breakout (like a failed high or low)
- Following a long trend, where a reversal is likely
For example, if you spot a bullish engulfing candle forming right at a key support zone, especially after a strong down move, that’s a strong sign of a potential reversal. The opposite is true for bearish engulfing candles at resistance after an uptrend.
How to Trade It
If you’re trading a bullish engulfing setup, you could enter a long trade right after the candle closes. Place your stop-loss just below the low of the engulfing candle and set your target based on the next resistance level or previous high. For bearish setups, enter short after the close, place your stop above the high, and target the next support zone. Some traders prefer to wait for a small pullback after the engulfing candle to get a better entry and tighter stop.
2. The Pin Bar (Rejection Candle)
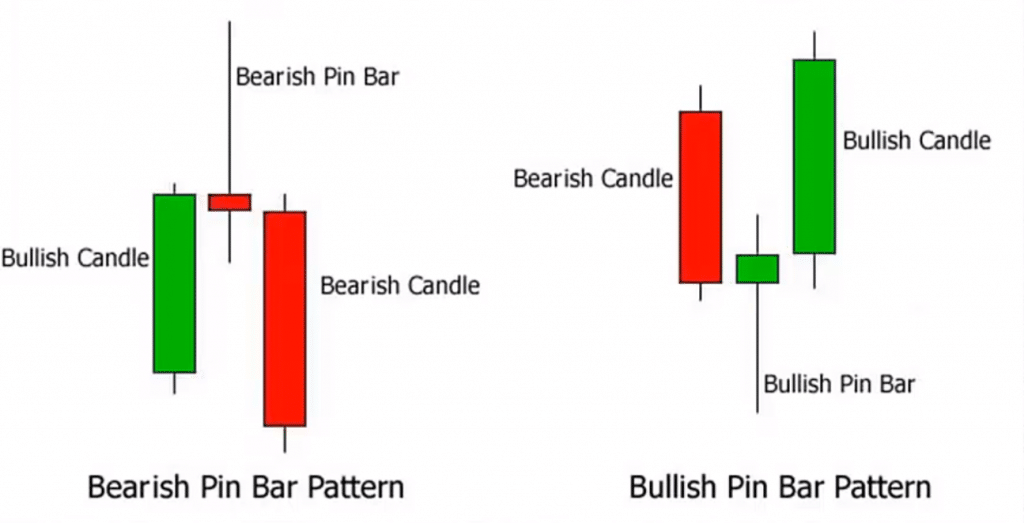
The pin bar, also known as a rejection candle, is a powerful single-candle pattern that signals a strong rejection of price at a key level. It’s named for its long wick or “tail” that looks like a pin sticking out from the body of the candle. This pattern shows that price tried to move in one direction but was forcefully pushed back, leaving behind a long wick and a small real body.
There are two types of pin bars:
- Bullish Pin Bar: Has a long lower wick and a small body at the top of the candle. This shows that sellers tried to push the price down, but buyers stepped in and drove it back up. It often signals a potential move up.
- Bearish Pin Bar: Has a long upper wick and a small body near the bottom. It shows that buyers tried to push the price higher, but sellers overwhelmed them, suggesting a possible move down.
Why It Matters
The pin bar is important because it clearly shows a battle between buyers and sellers, and who won that battle by the end of the candle. It often forms at turning points in the market, giving you a visual clue that price may be about to reverse. The long wick highlights where price was rejected, meaning traders didn’t agree with that price level, and pushed it back.
This pattern can also trap other traders who entered early. For example, if price looks like it’s breaking above resistance but then forms a bearish pin bar and closes lower, it suggests that breakout was false and sellers are now in control.
Best Places to Use It
Pin bars are most effective when they form at:
- Major support or resistance levels
- Swing highs or lows
- Trendlines or supply and demand zones
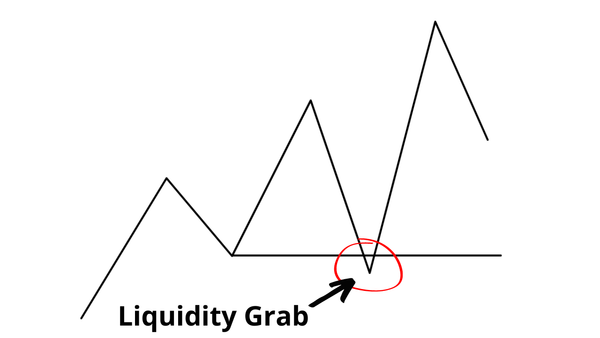
- After liquidity grabs (e.g. when price spikes to hit stops and quickly reverses)
For example, spotting a bullish pin bar just after a sweep of a key low could signal the end of a stop hunt and the start of a reversal to the upside.
How to Trade It
To trade a pin bar, many traders wait for the candle to close and then enter in the direction of the rejection.
- For a bullish pin bar, you could enter long after the candle closes, with your stop placed just below the low of the wick.
- For a bearish pin bar, enter short after the close, with your stop just above the wick’s high.
You can aim for a target at the next key level such as the most recent swing high or low or use a set risk-to-reward ratio like 2:1.
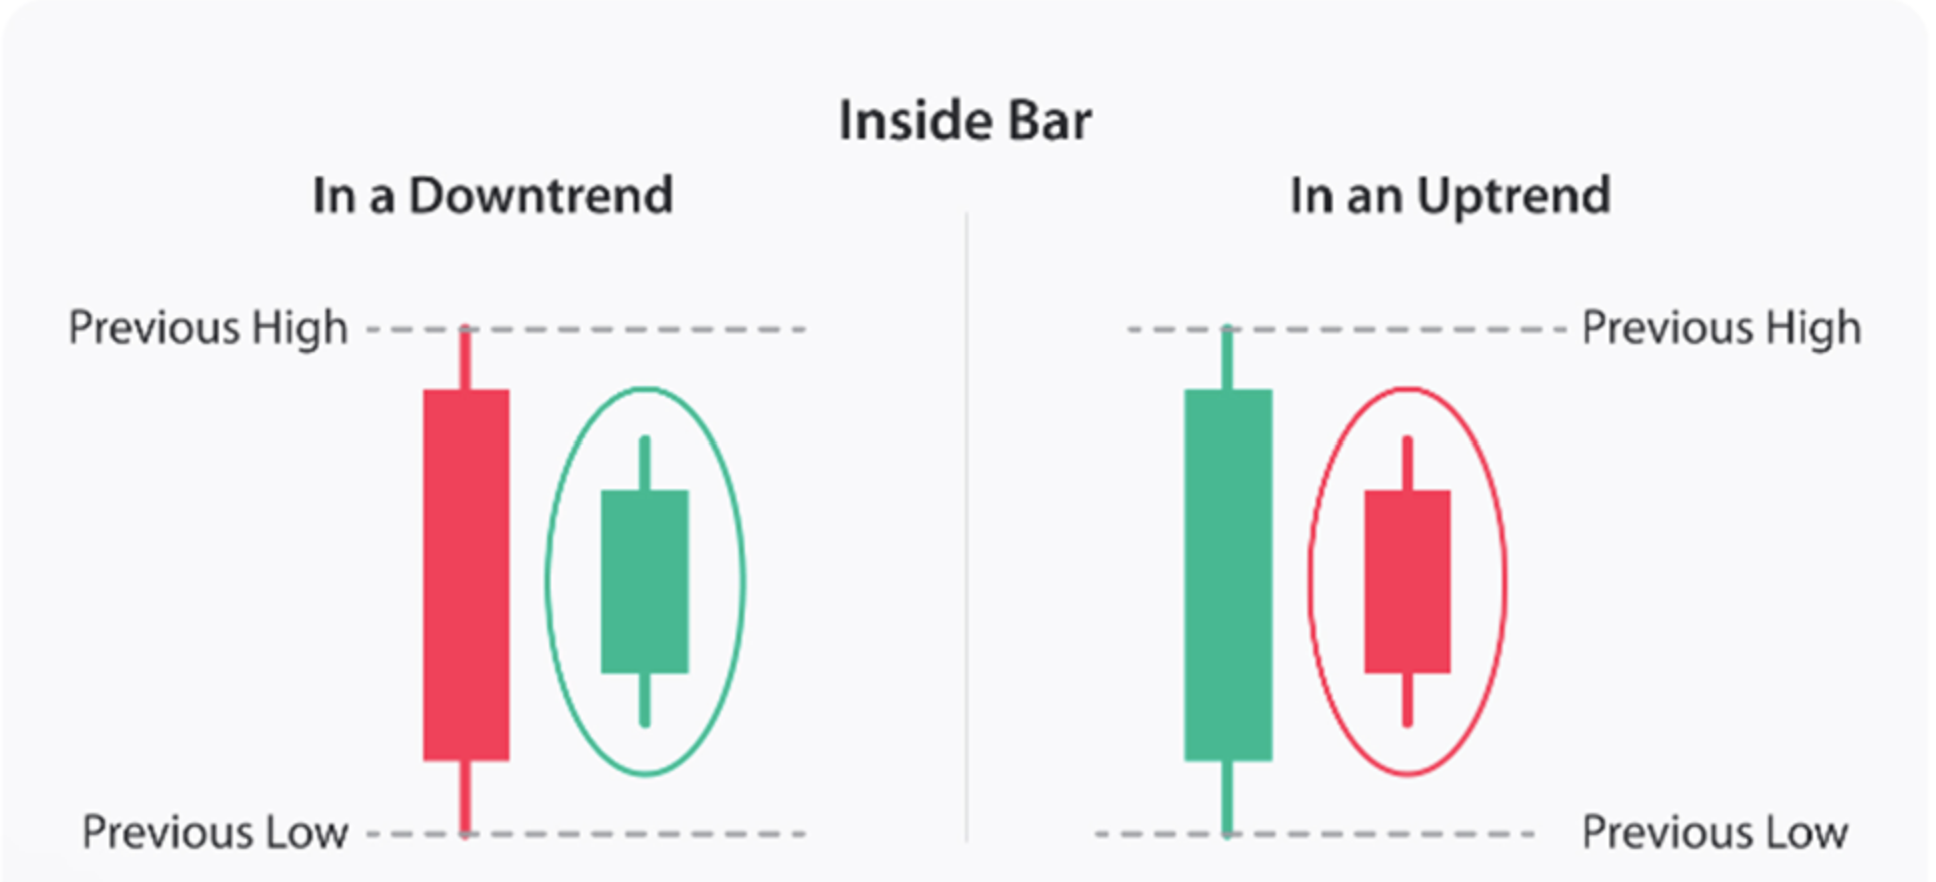
3. The Inside Bar
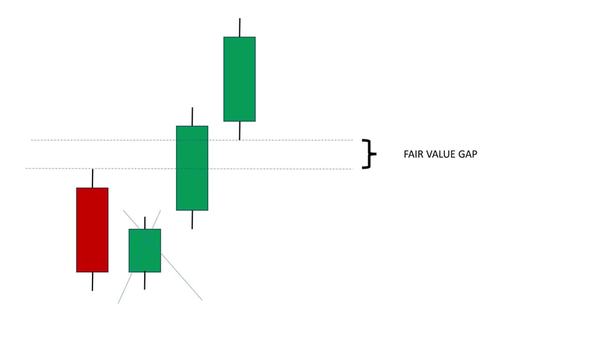
The inside bar is a two-candle pattern that represents a moment of pause or indecision in the market. It forms when a candle's entire range (its high and low) stays within the range of the previous candle. That previous candle is often referred to as the “mother bar”, and the smaller one inside it is the “inside bar”.
This pattern shows that after a strong move or during a moment of uncertainty, the market temporarily contracts or pauses. It can be a sign of consolidation, where price is gathering energy before making its next move.
Why It Matters
Inside bars are important because they often appear right before major price moves. They show a period of low volatility where neither buyers nor sellers are in control yet. After that pause, price usually breaks out in one direction, and the move can be sharp.
Inside bars can also act as continuation signals when they appear during trends, or as reversal signals when they form at major turning points. Their versatility makes them useful in many trading strategies.
Best Places to Use It
Inside bars work best when they appear:
- After a strong impulse move, as a pause before the next leg in the trend
- At key support or resistance zones, especially when followed by a breakout
- Near swing highs or lows, combined with other reversal signals
- During consolidation, to prepare for breakouts from ranges
For example, during an uptrend, an inside bar near support may suggest buyers are resting before pushing higher again. In a ranging market, an inside bar at the edge of the range could signal a breakout attempt.
How to Trade It
There are two common ways to trade inside bars:
- Breakout Strategy
Wait for price to break above or below the range of the mother bar. Enter in the direction of the breakout. You can place your stop-loss on the opposite side of the mother bar or inside bar, depending on how aggressive you want to be.- Bullish setup: Enter when price breaks above the mother bar’s high.
- Bearish setup: Enter when price breaks below the mother bar’s low.
- Fakeout Reversal
Sometimes, price fakes out in one direction and then reverses hard in the other. To trade this, wait for a breakout and failure on one side of the inside bar, then enter in the opposite direction after price returns inside the range.
In both strategies, it’s smart to use confirmation from structure, volume, or a trendline to increase your confidence in the trade. Inside bars are more reliable when they align with the broader market context.
How to Use These Patterns in Real Trades
While these candle patterns are powerful, they should never be used alone. They become more effective when combined with:
- Market structure (support/resistance, trendlines)
- Confirmation (volume, follow-through candles)
- Risk management (stop-loss just outside the candle)
For example, if you see a bullish engulfing candle at support, followed by a small pullback, that might be a good place to enter with your stop just below the low of the engulfing candle. The goal is to use these patterns to time your trades with more confidence and clarity.
Conclusion
You don’t need to memorize dozens of candle patterns. These three which are engulfing candles, pin bars, and inside bars show up often and give clear signals when used in the right place. With practice, you’ll start to recognize them faster and make better trading decisions. Keep your chart clean, follow the trend or structure, and use candles as your price-action guide.
Frequently Asked Questions (FAQs)
1. Do candle patterns work on all timeframes?
Yes, but higher timeframes (like 1-hour or 4-hour) usually give more reliable signals than 1-minute or 5-minute charts.
2. Are these patterns enough to trade on their own?
Not really. It’s best to use them with support/resistance, structure, or confirmation tools.
3. Can I use these patterns for crypto or forex?
Yes. They work in all markets that use candlestick charts.
4. How many candles do I need to wait after a pattern forms?
Often one or two candles are enough to confirm the move. Look for follow-through in price.
5. Should I trade every time I see one of these?
No, context matters. Only trade patterns when they happen in strong locations or setups.