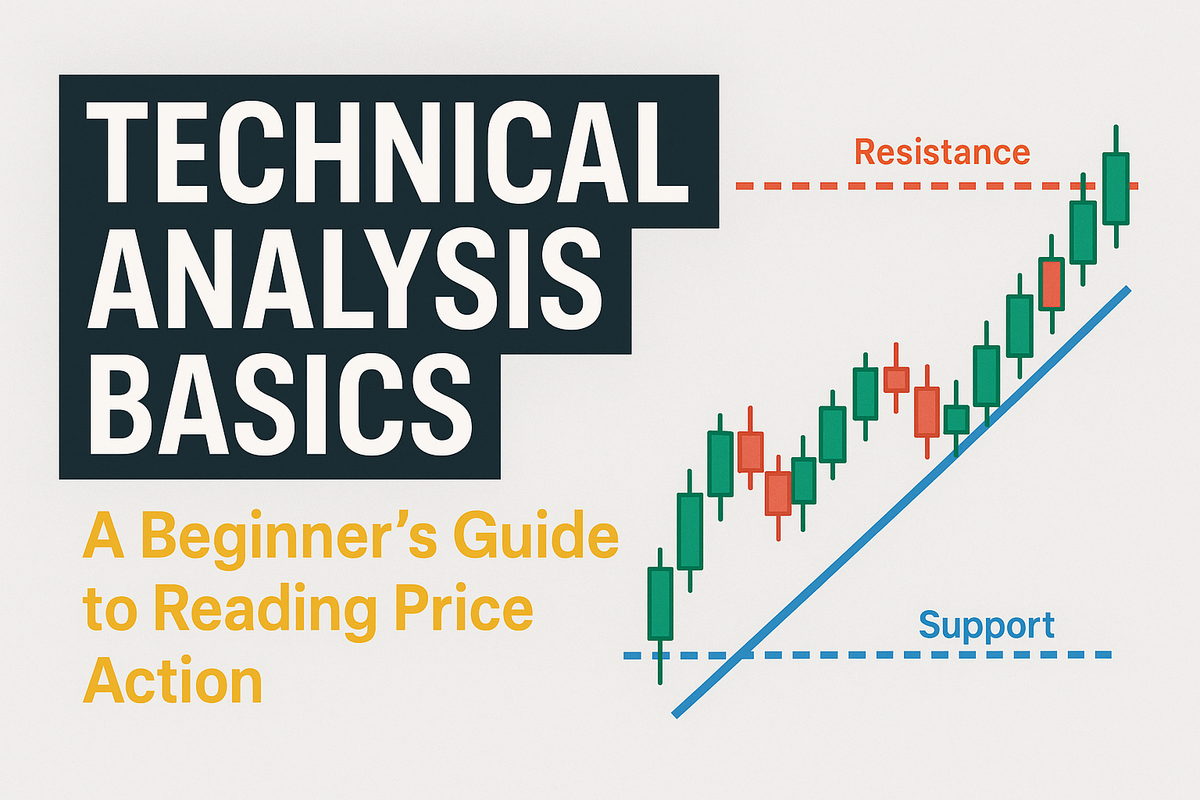
Technical Analysis Basics: A Beginner’s Guide to Reading Price Action
I’m going to walk you through the fundamentals of reading price action using technical analysis—what it is, how it works, and how to use it without feeling like you need a PhD in finance.

"Forget the quick win. Build the skill that pays forever." — Trade Life Mastery
When I first got into trading, the charts looked like chaos—lines going up and down, candles flickering like a heartbeat, and everyone throwing around words like RSI, MACD, and “support levels.” Sound familiar? If you’re just starting out and feeling overwhelmed, you’re not alone. The good news is, once you understand the basics of technical analysis, those same charts start telling a story.
In this post, I’m going to walk you through the fundamentals of reading price action using technical analysis, what it is, how it works, and how to use it without feeling like you need a PhD in finance. We’ll also touch on technical analysis vs fundamental analysis, and I’ll share some simple tips to help you stay consistent and focused as you grow.
Key Takeaways:
- Technical analysis helps traders understand market psychology and price movement using charts.
- Basic tools include support/resistance, trendlines, and indicators like RSI or MACD.
- Candlestick patterns and volume give clues about potential reversals or breakouts.
- New tools like AI chart scanners and modern indicators can speed up analysis.
- The goal is to find high-probability trade setups based on price behavior, not predictions.
What is Technical Analysis? (Explained Simply)
Let me explain this as simply as I can. Technical analysis is the practice of studying historical price movements, mainly through charts, to make informed trading decisions. Instead of focusing on a company’s earnings report or macroeconomic news, technical traders look at price, volume, and patterns on a chart.
You can think of it like this: If the market is a crowd of people, technical analysis is about observing their behavior. Are they excited and pushing the price up? Or fearful and selling everything off?
Technical analysis explained simply, means understanding the psychology of buyers and sellers through patterns. It’s like learning to “read the room”—but the room is the market.
Technical Analysis vs Fundamental Analysis
Many beginners ask, “Should I use technical or fundamental analysis?” Great question.
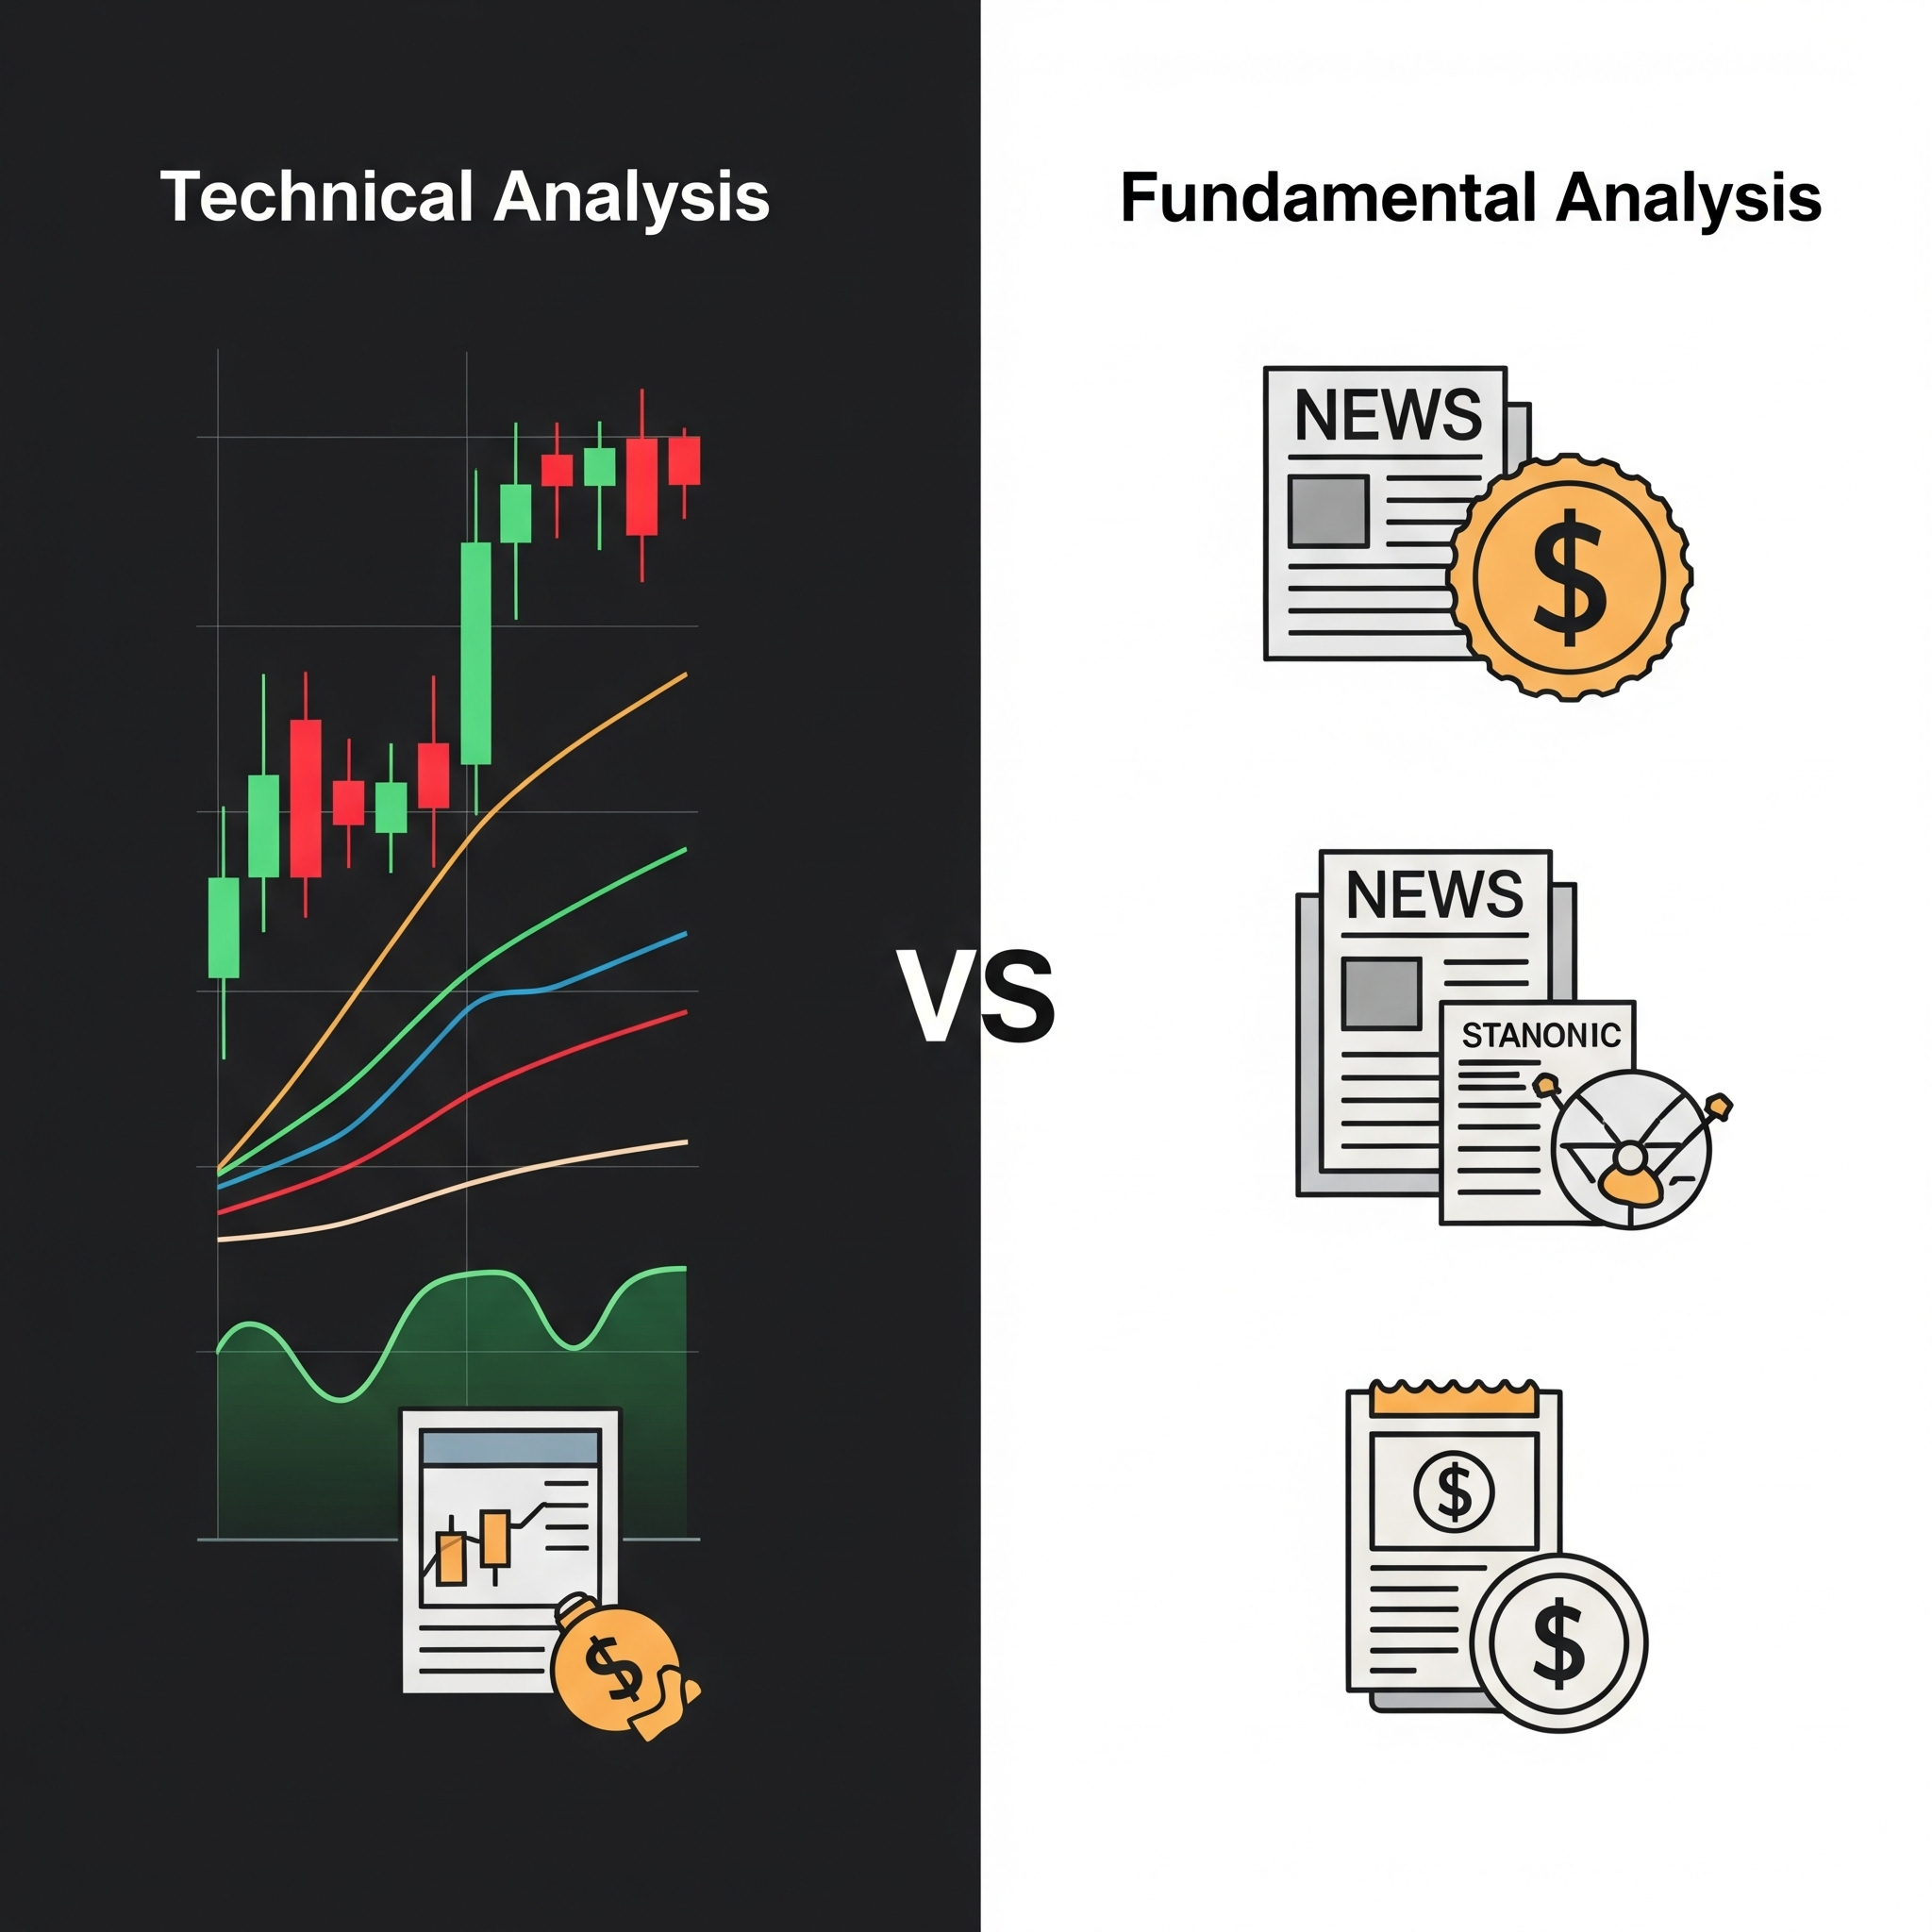
Technical analysis vs fundamental analysis boils down to what you’re focusing on. Fundamental analysis looks at the “why”—earnings, economic news, and interest rates. Technical analysis, on the other hand, focuses on the “what”—what price is doing right now.
A quick comparison:
| Technical Analysis | Fundamental Analysis |
|---|---|
| Focuses on price action & charts | Focuses on news, earnings, data |
| Great for short-term trades | Better for long-term investing |
| Based on market psychology | Based on company or economy health |
Most traders blend both. Personally, I lean on the technical side because price action is what ultimately reflects market behavior.
Tip: Learn to read candlestick patterns to spot these behaviors clearly. How to Read Candlestick Patterns.
Key Concepts of Technical Analysis
Let’s now dive into basic technical analysis, the core ideas you need to know to start reading charts like a trader.
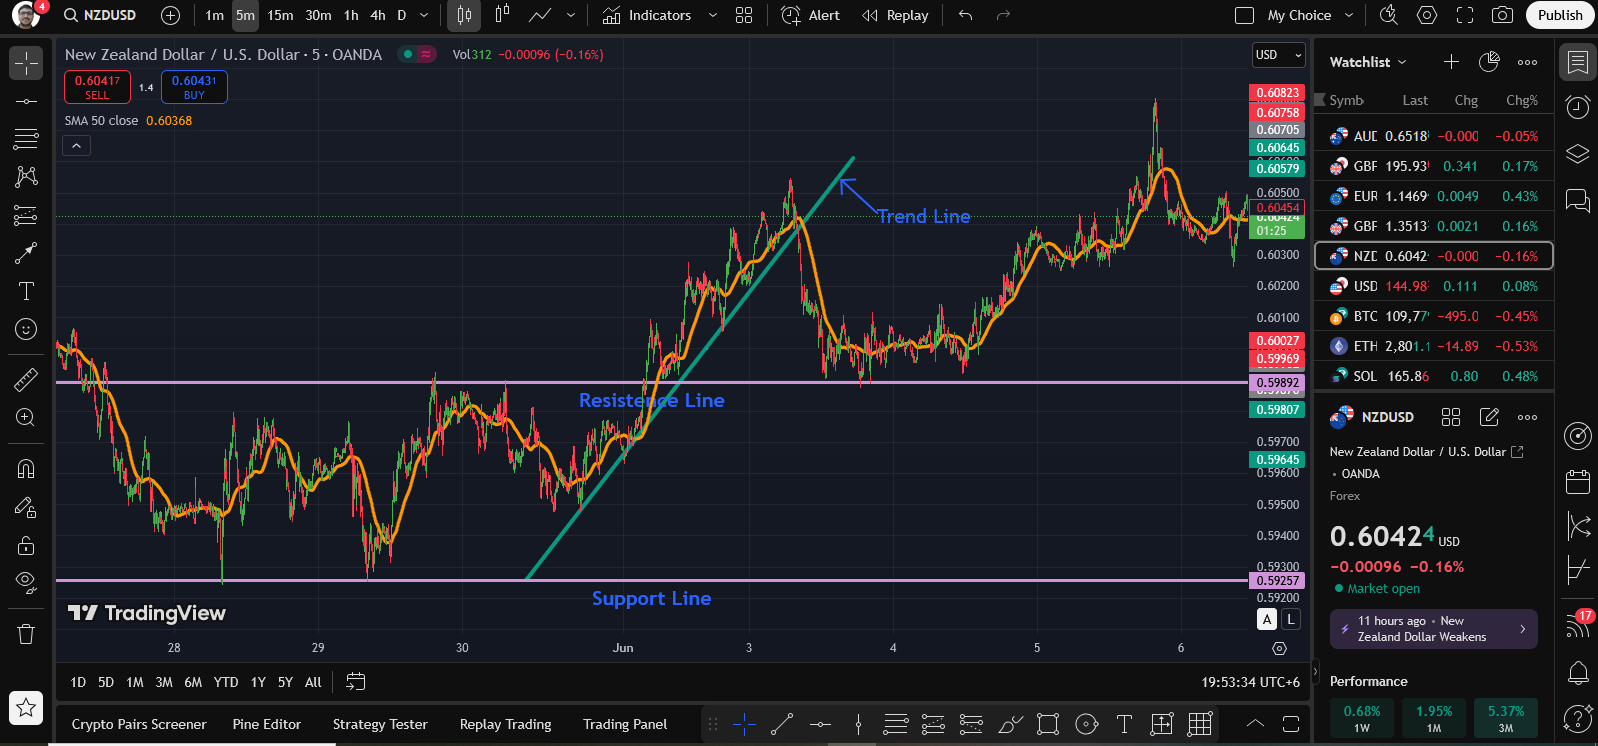
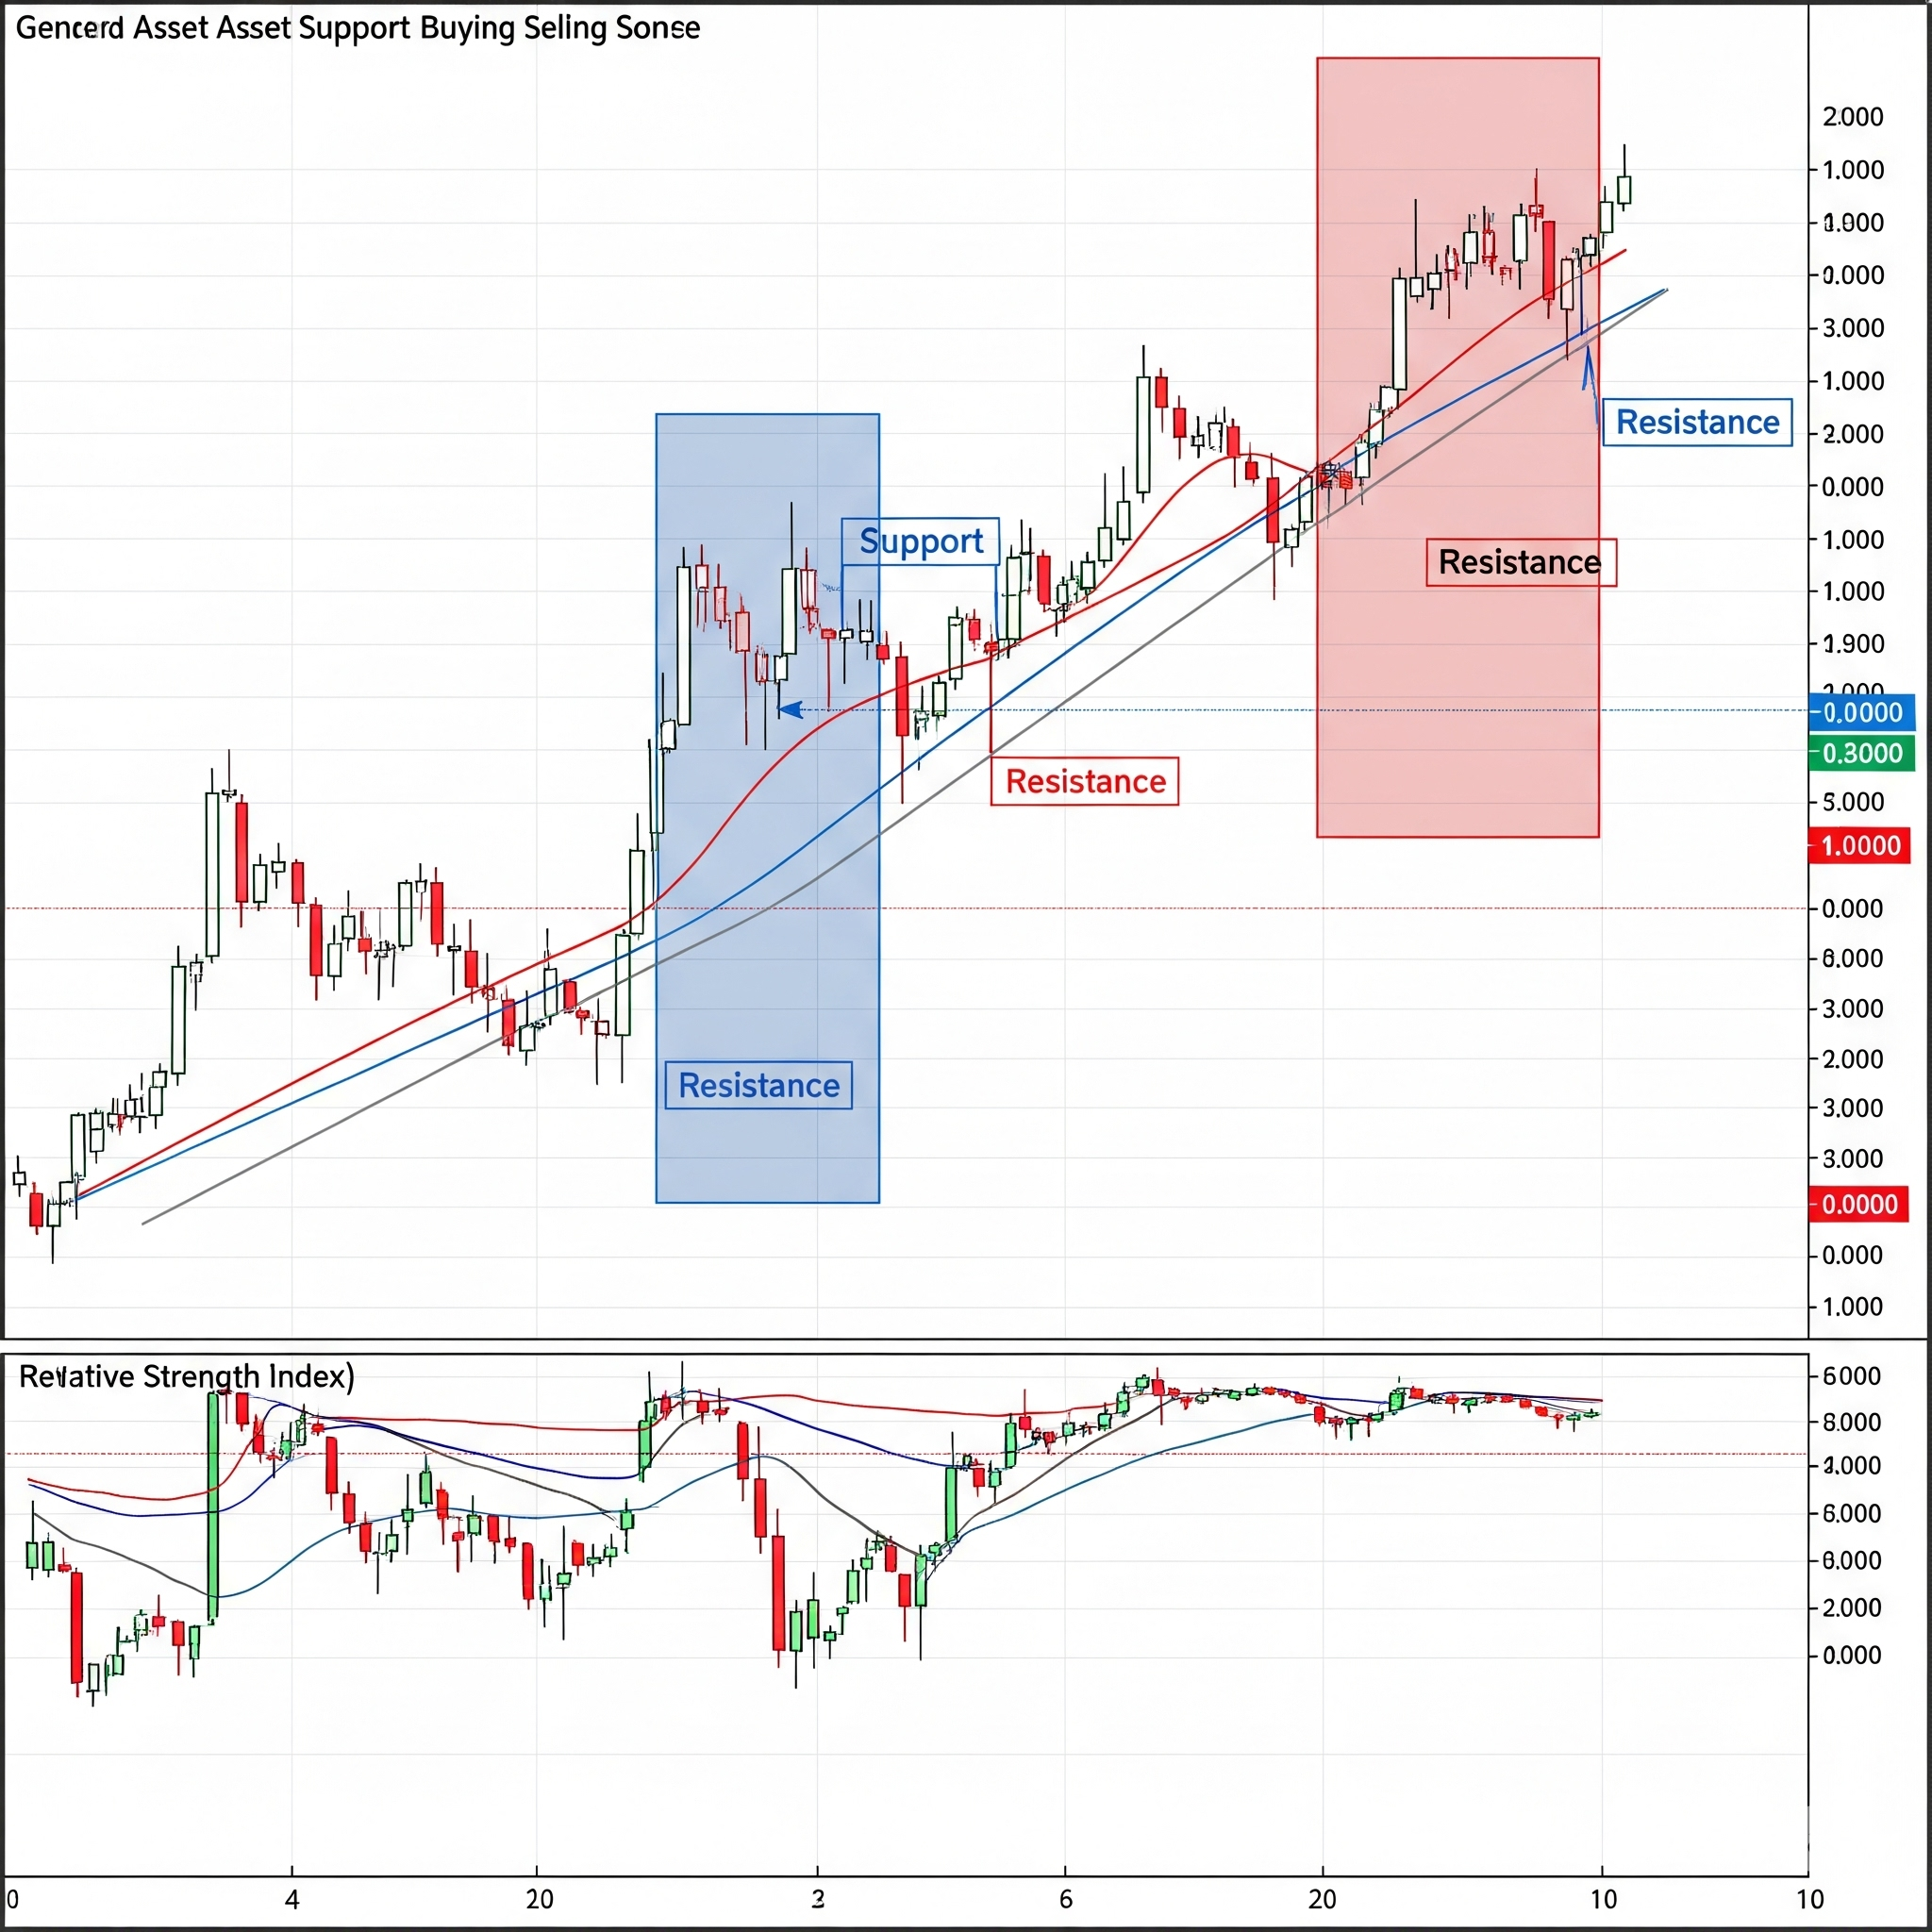
Support and Resistance
Think of support as a floor where the price tends to stop falling, and resistance as a ceiling where the price often struggles to break through. These are key areas where buyers and sellers fight for control.
Trends and Trendlines
A trend is simply the direction the market is moving—up, down, or sideways. Drawing trendlines helps you visualize the flow. I often use them to stay aligned with market momentum.
Volume
Volume tells you how much of an asset is being traded. High volume often confirms a strong move. For instance, if a breakout happens on high volume, it’s more likely to be real.
Indicators
You don’t need a hundred indicators. Just start with a few basics:
- Moving Averages: Help smooth out price and show overall direction.
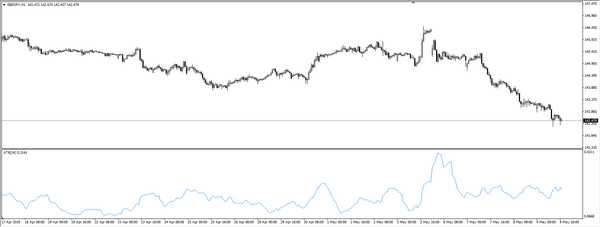
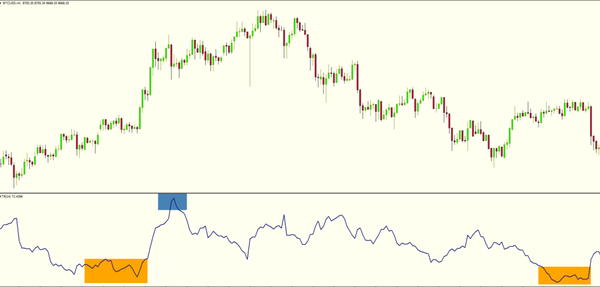
- RSI (Relative Strength Index): Shows if something is overbought or oversold.
A quick example: Let’s say Bitcoin is trending up, and the RSI hits 80. That tells you the asset is potentially overbought, and a pullback could be near. This is where technical analysis for dummies becomes practical.
For more on-trend strategies, check out Mastering Breakout Trading or Understanding Market Structure.
Emerging Tools in Technical Analysis
Modern traders have access to far more than just trendlines and moving averages. Here are a few recent tools reshaping technical analysis:
1. AI-Based Chart Scanners
Platforms like TrendSpider, Trade Ideas, and Tickeron now offer machine learning-powered scanning tools. These help identify patterns, divergence, volume spikes, and more — automatically and in real-time.
Example: TrendSpider’s Smart Checklists combine multiple indicators and highlight confluence zones for breakout or reversal trades.
2. Real-Time Pattern Recognition
Many brokers now offer built-in pattern recognition tools that detect common formations like triangles, head & shoulders, or flags — removing the guesswork from manual charting.
3. Enhanced Volume Profiles & Order Flow Tools
Software like Bookmap and Sierra Chart show depth of market and microstructure, helping traders see where big players are active.
4. Heatmaps and Sentiment Indicators
Visual tools like heatmaps show where volume clusters or open interest build. This helps traders align with likely areas of action or manipulation.
How Does Technical Analysis Work?
You might wonder, how does technical analysis work if it’s not based on news or fundamentals?
It works because markets are driven by human behavior—fear, greed, optimism. These emotions often repeat in recognizable patterns. Technical analysis gives us tools to identify those patterns and respond with better timing and strategy.
But here’s the truth: it’s not about predicting the future. It’s about stacking the odds in your favor and making educated decisions based on what’s already happening.
Pro Tip: Combine it with volume and context for more reliable setups. Check out VWAP Trading Strategy for an example.
Is Technical Analysis Effective?
How effective is technical analysis really? Well, it depends on how you use it.
Used correctly with risk management and emotional control, it’s incredibly useful. But if you chase every pattern without a plan, it can quickly become guesswork.
The best traders I’ve met don’t rely on just one tool. They focus on discipline, manage risk, and never risk more than they’re comfortable losing. That’s the real edge.
Want to dive deeper into risk control? I recommend Mastering Risk Management and Understanding Risk-Reward Ratio.
My Beginner Advice: Keep it Simple & Stay Consistent
Let me give it to you straight: don’t overcomplicate things. Technical analysis made easy is about sticking to a few tools, learning them well, and journaling your trades.
I spent months chasing shiny indicators before realizing that simplicity wins. Price action, a few levels, and a trendline—that’s often all you need.
More important than any tool is your mindset. Patience, emotional control, and the discipline to follow your plan are what separate pros from gamblers.
Need help with mindset? Start with The Psychology of Trading or How to Keep a Trading Journal.
Final Thoughts
If you’ve made it this far, great job. You’ve just taken a big step toward understanding the basics of technical analysis. It’s not about knowing everything right away. It’s about building a foundation and growing from there.
Start slow, stay curious, and remember, consistency beats intensity in trading.
Have questions? Drop them in the comments or reach out, I’m here to help.
FAQs
Q1: Do I need to learn technical analysis if I use signals?
Yes. Understanding charts helps you verify the quality of signals and avoid blindly copying trades.
Q2: Is technical analysis better than fundamental analysis?
They serve different purposes. Technical analysis is more short-term focused, while fundamental analysis is long-term.
Q3: Can I use technical analysis on all assets?
Yes, it works across forex, stocks, crypto, and commodities — though behavior may vary.
Q4: What’s the best chart timeframe to use?
That depends on your strategy. Day traders may prefer 5–15 min charts, while swing traders use 1H–1D.
Q5: How do I avoid false signals?
Use confirmation: wait for candle closes, volume validation, and combine multiple indicators.