RSI Indicator Made Simple: How to Read and Use RSI
RSI doesn’t have to be complicated. In this beginner-friendly guide, you’ll learn how to read RSI correctly, use it in trending vs ranging markets, and identify smart entry signals using structure, divergence, and real chart examples.
The Relative Strength Index (RSI) is one of the most widely used indicators in technical analysis. Whether you're trading forex, crypto, stocks, or commodities, RSI is a go-to tool for identifying momentum, spotting reversals, and confirming trends. But despite its popularity, many traders misuse RSI or oversimplify its signals.
In this updated guide, we’ll break down exactly how RSI works, what its readings really mean, and how to use it properly to make smarter trading decisions without any confusing jargon.
Key Takeaways
- RSI measures the speed and strength of price movements.
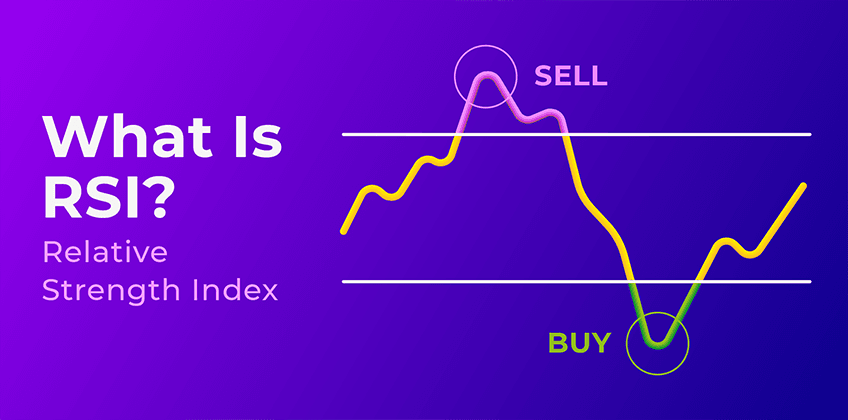
- Readings above 70 suggest overbought conditions; below 30 indicate oversold.
- RSI is best used with confirmation tools like structure, divergence, or trend filters.
- Different strategies suit trending vs ranging markets.
- Always combine RSI with price context for stronger setups.
What is RSI and How Does It Work?
RSI stands for Relative Strength Index. It’s a momentum oscillator that ranges between 0 and 100, typically based on the last 14 periods. It calculates the ratio of average gains to average losses over time and transforms that into a value you can read visually.
- Above 70: Traditionally considered overbought (price may pull back).
- Below 30: Considered oversold (price may bounce).
However, RSI doesn’t guarantee reversals. It simply alerts you that price is stretched and due for a slowdown or correction.
How to Read RSI on a Chart
On most trading platforms like TradingView or MT4, RSI appears below your price chart. The middle line is at 50. Here's how to interpret it:
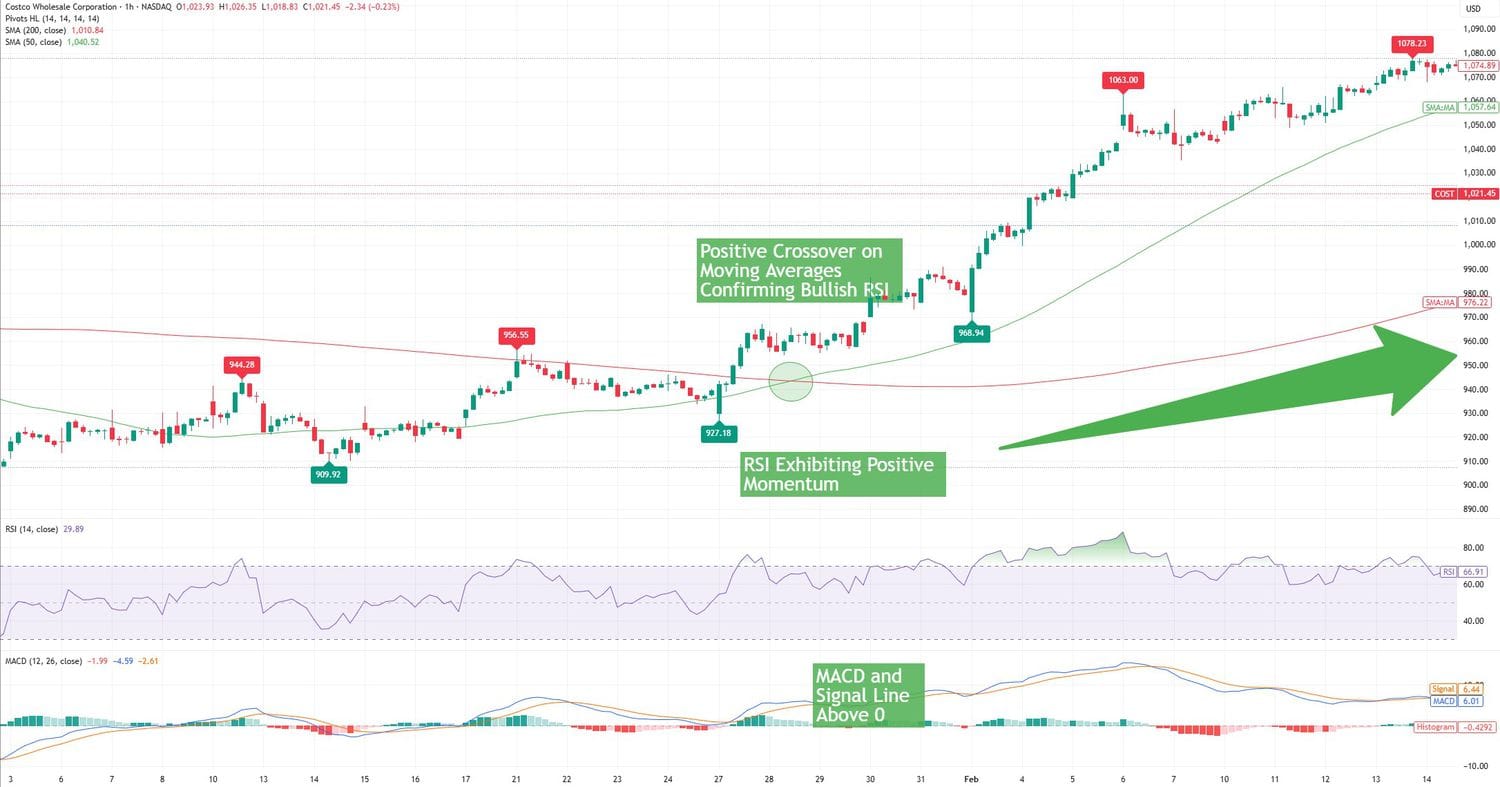
- RSI rising above 50: Bullish momentum.
- RSI falling below 50: Bearish momentum.
- Price in uptrend + RSI above 50 = trend confirmation.
- Price forming a reversal + RSI divergence = potential setup.
When Is RSI Most Useful?
In Ranging Markets
Ranging markets occur when price moves sideways between horizontal support and resistance zones without a clear upward or downward trend. In this environment, RSI tends to behave predictably, oscillating between 70 and 30.
Why RSI works well here:
- Momentum regularly stretches in both directions without major follow-through.
- Traders can use RSI to buy low and sell high, capitalizing on smaller swings.
How to use it:
- Buy setup: RSI drops near or below 30 while price bounces from a known support level.
- Sell setup: RSI rises near or above 70 while price approaches a resistance level.
Pro Tips:
- Look for candlestick confirmation like a hammer, doji, or bullish engulfing pattern near RSI 30.
- Add horizontal support/resistance lines to your chart for visual reference.
- Use shorter RSI settings (like 7 or 9) for quicker signals in low-volatility environments.
Example:
EUR/USD is stuck between 1.0800 and 1.1000. RSI dips below 30 at the lower range, forming a double bottom. A bullish candle appears which means perfect time to enter a long with a tight stop.
In Trending Markets
Trending markets are defined by higher highs and higher lows (uptrend), or lower highs and lower lows (downtrend). In these cases, RSI behaves differently and misusing it can lead to premature reversals.
Why RSI needs adjustment:
- In an uptrend, RSI can stay overbought (above 70) for extended periods.
- In a downtrend, RSI may remain oversold (below 30) without reversing.
Instead of fading the move, do this:
- In Uptrend:
- Wait for RSI to pull back to the 40–50 zone (momentum support).
- Watch for price to form a higher low and bullish structure.
- Use this area to enter trades with the trend, not against it.
- In Downtrend:
- Look for RSI to rally to the 50–60 zone and stall.
- Enter short when price respects a lower high or hits resistance.
Pro Tips:
- Combine with moving averages (e.g., 20 EMA) to define trend direction.
- Avoid entering based solely on RSI touching 70 or 30—check structure first.
- Look for RSI bullish/bearish continuation patterns inside the pullback zone.
Example:
Bitcoin is in a strong uptrend. RSI dips to 45 while price retests the previous breakout level. A bullish pin bar forms which is a classic RSI-supported trend continuation entry.
Divergence: The RSI Reversal Clue
Divergence happens when RSI moves in the opposite direction of price. It often signals that momentum is weakening and a reversal could follow.
Types of Divergence:
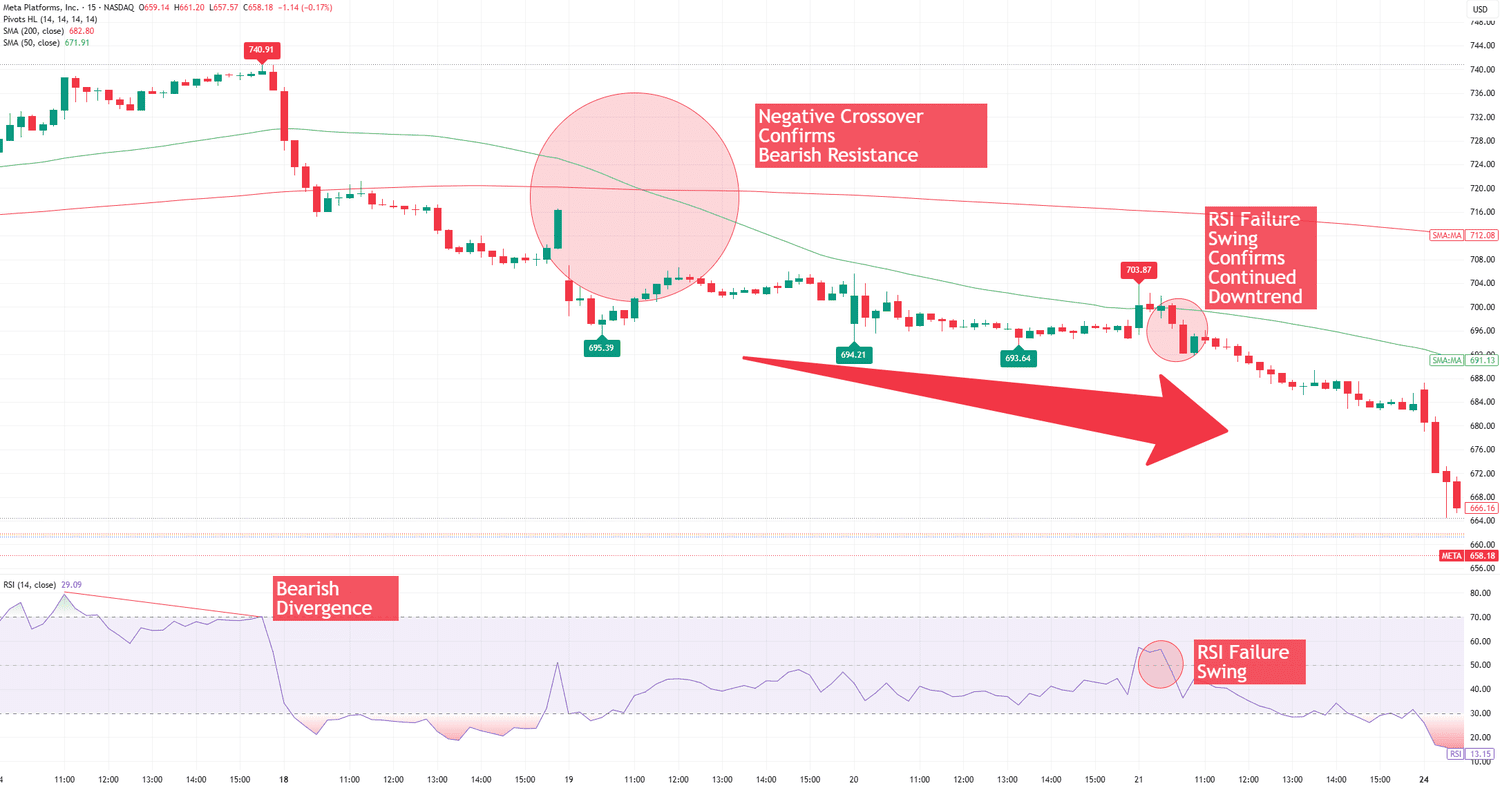
- Bearish Divergence: Price makes a higher high, RSI makes a lower high → possible trend reversal down.
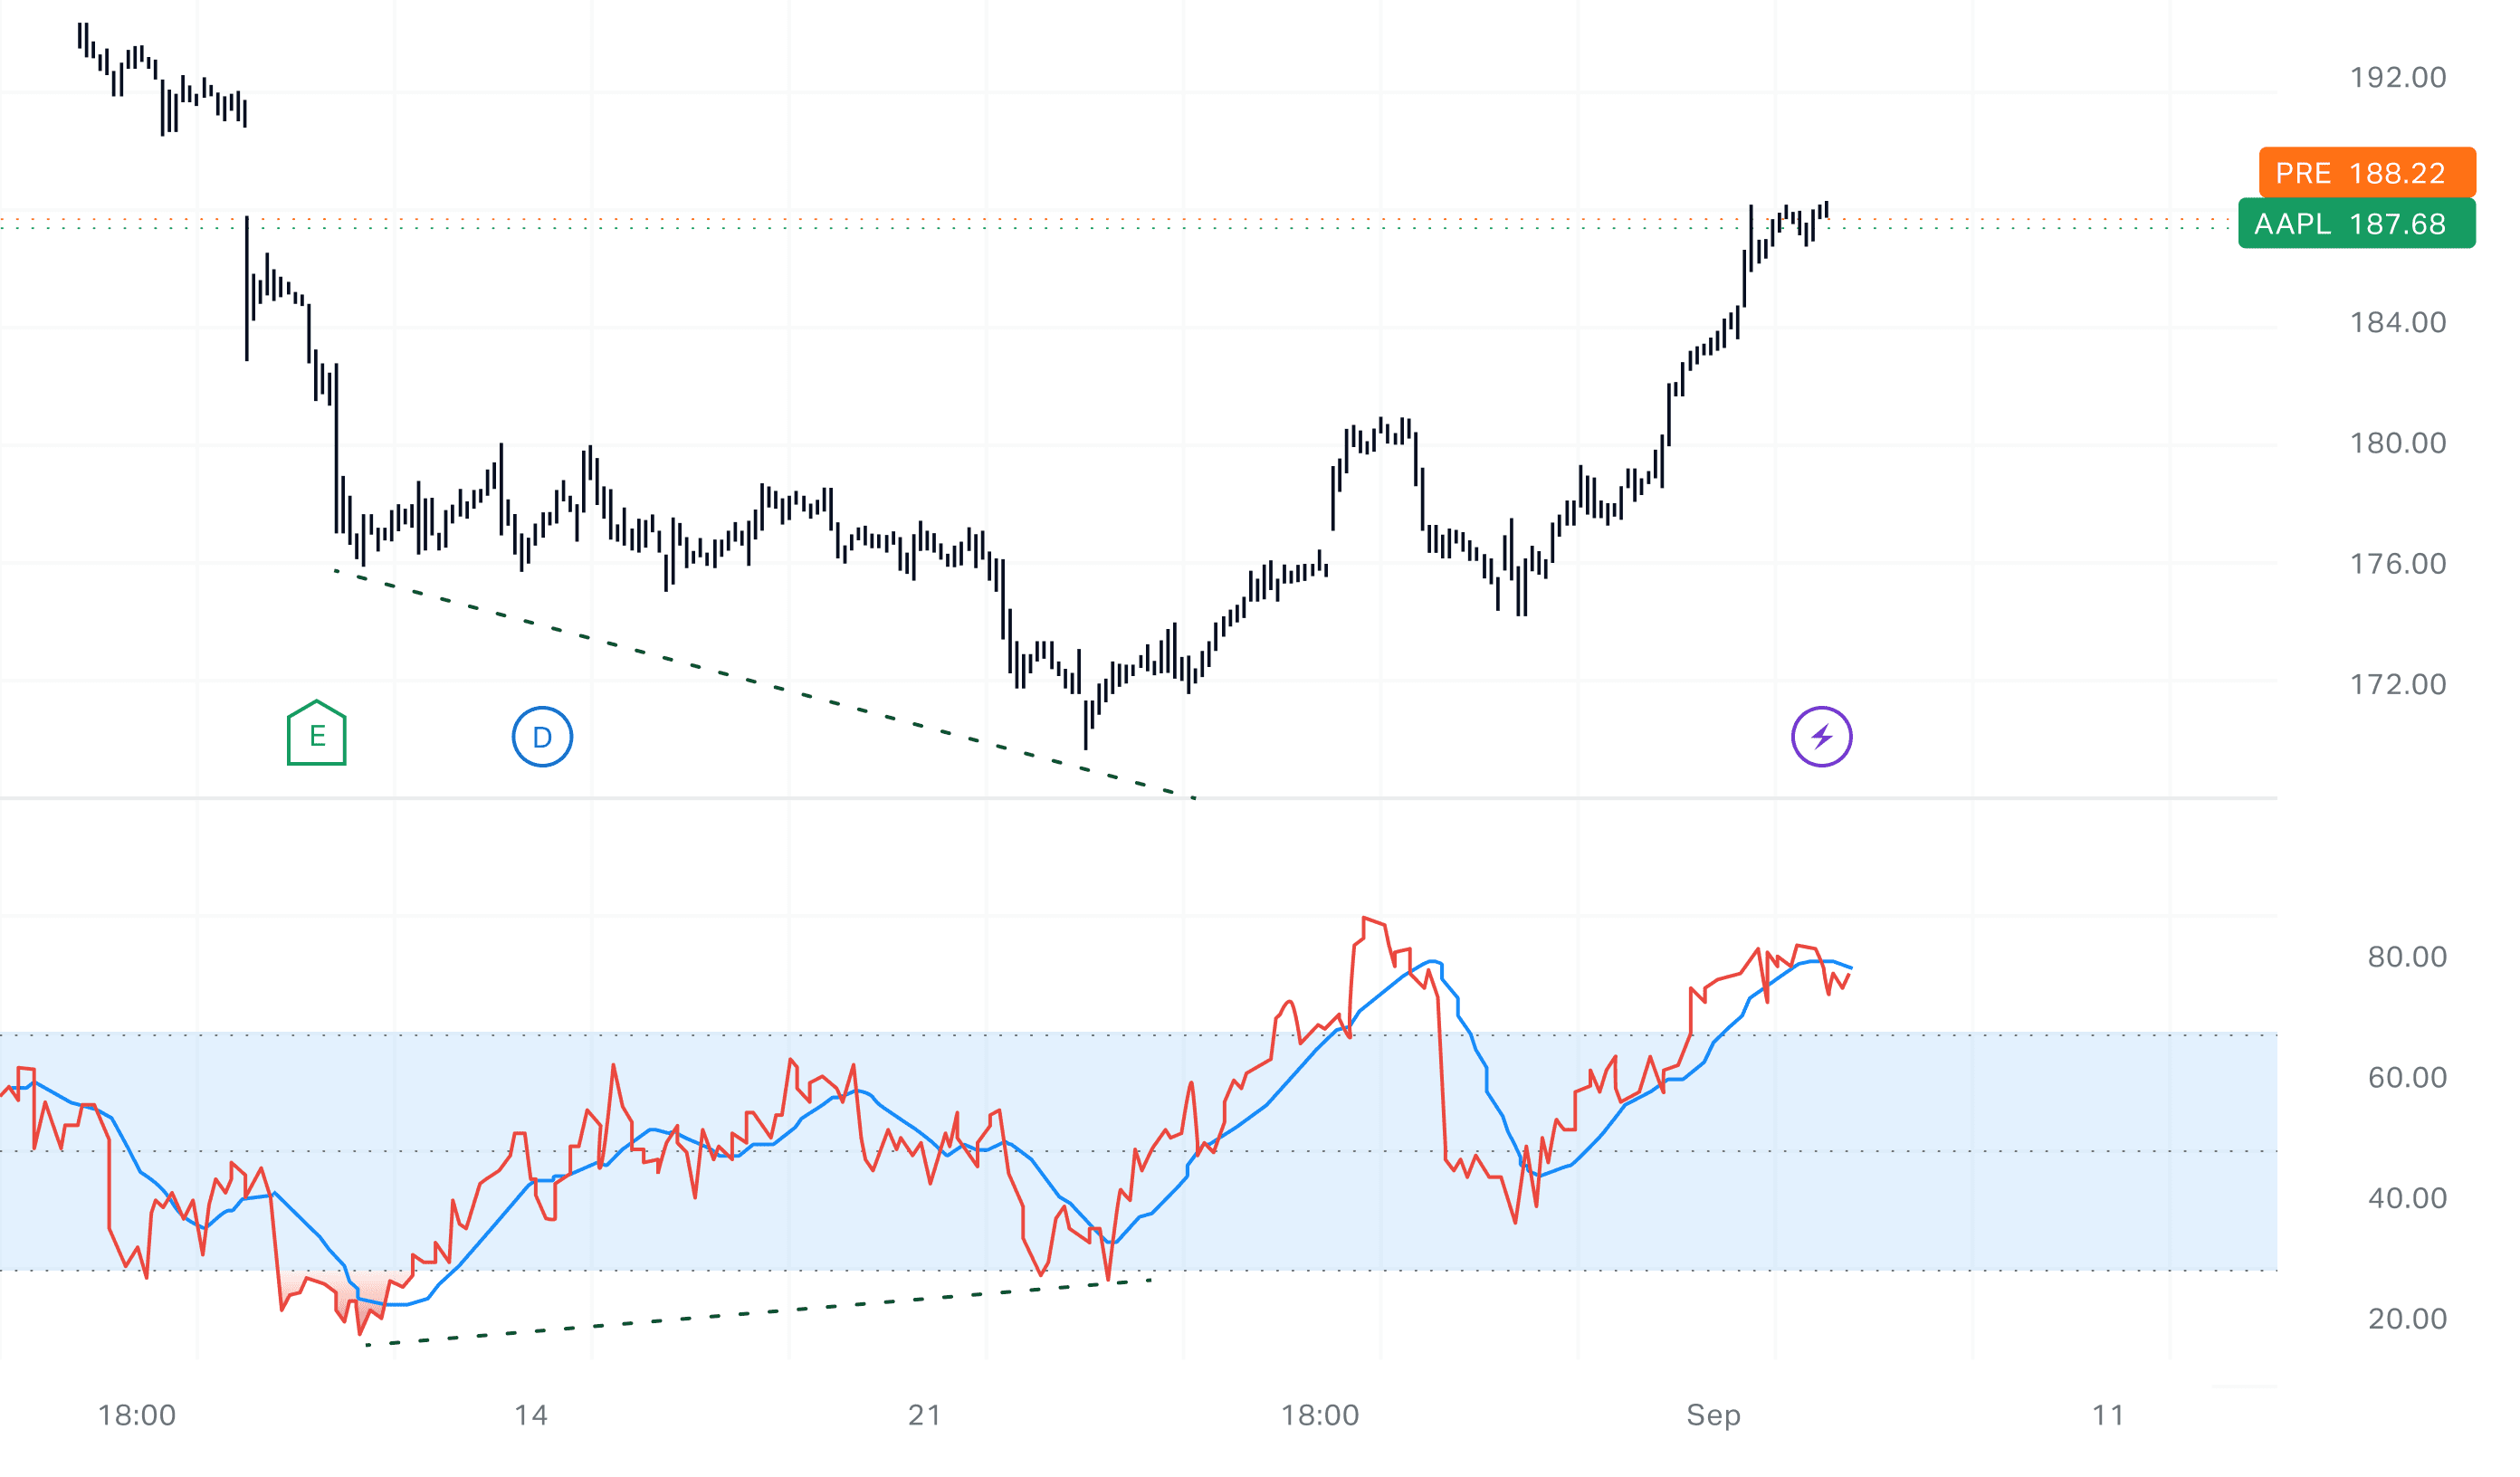
- Bullish Divergence: Price makes a lower low, RSI makes a higher low → possible reversal up.
Pro Tip: Divergence is strongest when it occurs near a significant support/resistance zone or trendline.
How to Use RSI Effectively (With Structure)
To avoid false signals, combine RSI with:
- Support and resistance
- Trendlines or moving averages
- Candlestick patterns (pin bars, engulfing candles)
- Volume spikes (to validate momentum shifts)
Example Setup:
- Price hits a support zone.
- RSI drops below 30 and starts to turn up.
- A bullish engulfing candle forms.
- Entry: Buy after candle close. Stop below the support.
RSI Strategy Examples
1. Basic Reversal Strategy
- Buy: RSI < 30 + support + bullish candle.
- Sell: RSI > 70 + resistance + bearish candle.
2. Divergence Reversal
- Bullish: Lower low in price, higher low in RSI.
- Bearish: Higher high in price, lower high in RSI.
3. Trend Pullback Entry
- In uptrend: Buy RSI pullback to 40–50.
- In downtrend: Sell RSI rally to 50–60.
Quick RSI Cheat Sheet
|
Condition |
What It Means |
What to Watch For |
|
RSI > 70 |
Overbought |
Wait for weakness / reversal signs |
|
RSI < 30 |
Oversold |
Look for
strength / bounce potential |
|
RSI Divergence |
Momentum shift |
Confirm with structure or price action |
|
RSI > 50 in
uptrend |
Bullish
strength |
Look for
trend continuation setups |
|
RSI < 50 in
downtrend |
Bearish strength |
Favor short entries on pullbacks |
Conclusion
RSI is a powerful tool but only when used with price context. It shouldn’t be treated as a standalone entry trigger. Think of RSI as a momentum thermometer: it helps you read the market’s strength, but you need structure and confirmation to act on it.
Use RSI in combination with support/resistance, price patterns, or divergence. With a bit of patience and discipline, it can help you time trades more effectively and avoid costly mistakes.
Frequently Asked Questions (FAQs)
1. What’s the best RSI setting?
Default is 14. For faster signals, try 7. For smoother signals, use 21.
2. Can RSI be used in crypto trading?
Yes! RSI works well with crypto due to its volatile swings.
3. What’s the difference between RSI and Stochastic?
Both measure momentum, but RSI smooths its signal. Stochastic is more sensitive.
4. How do I filter out false RSI signals?
Look for RSI confirmation at key levels, with trend context and price rejection.
5. Should I use RSI alone?
No, combine it with structure, trend, and candlestick confirmation for better results.


