MACD vs RSI: Which Momentum Indicator Is Better?
Not sure whether to use MACD or RSI? This beginner-friendly guide breaks down the strengths of both indicators, when they work best, and how using them together can help you trade smarter and spot better entries.
"Indicators are like tools in a toolbox, the real skill is knowing which one to use, and when."
— Unknown
MACD and RSI are two of the most popular tools used in trading. Both help traders understand momentum whether price is gaining strength or slowing down. But they work in different ways, and knowing how each one works can help you choose the right tool for your trades. In this article, we’ll break down how MACD and RSI compare and which one might be better for you.
Key Takeaways
- MACD tracks momentum and trend direction using moving averages.
- RSI measures how fast price moves to find overbought or oversold zones.
- MACD is better for spotting trend changes; RSI is better for timing entries.
- Both tools are more powerful when used with other signals like support or resistance.
- The best choice depends on your trading style and the market you're trading.
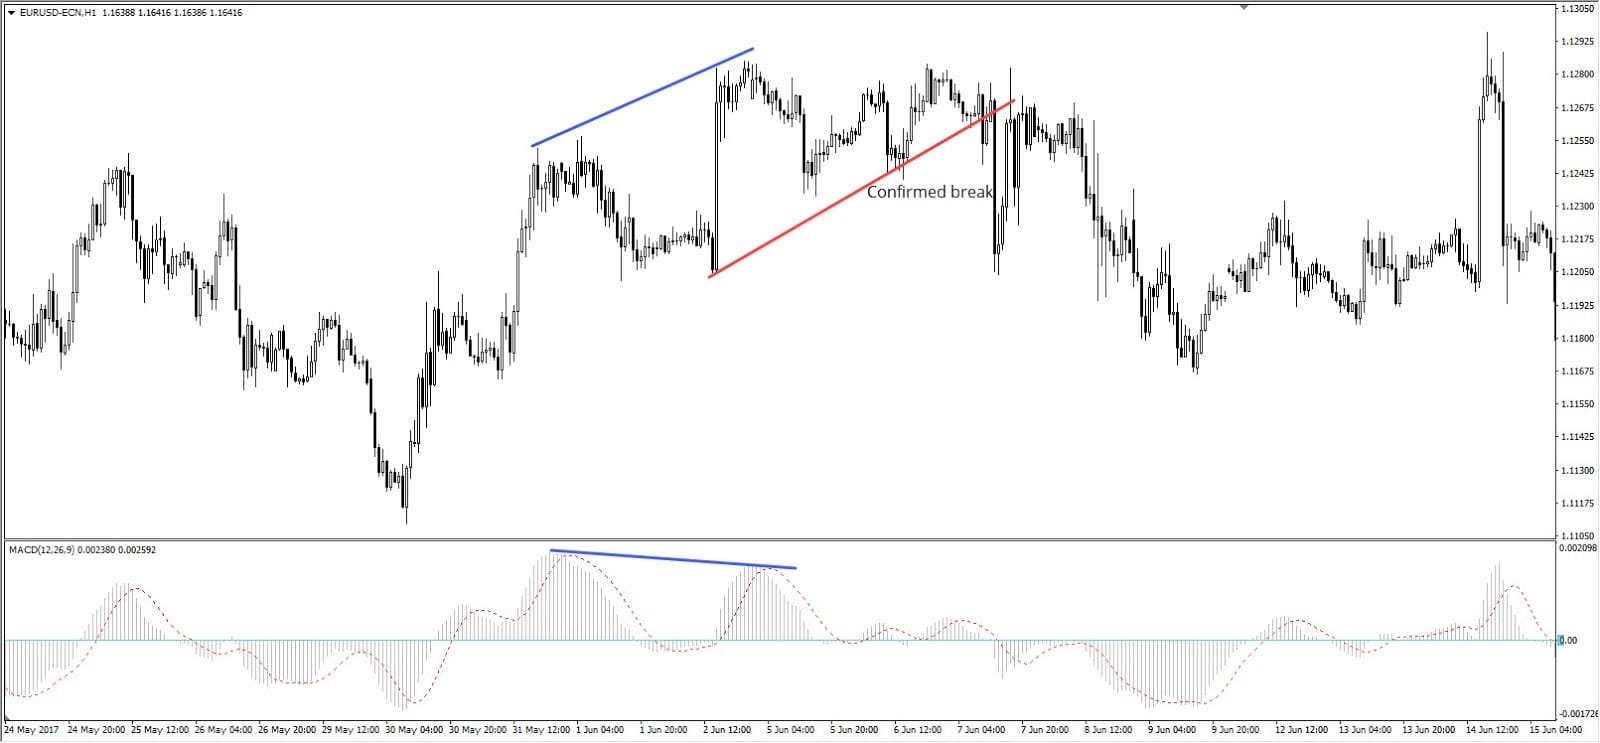
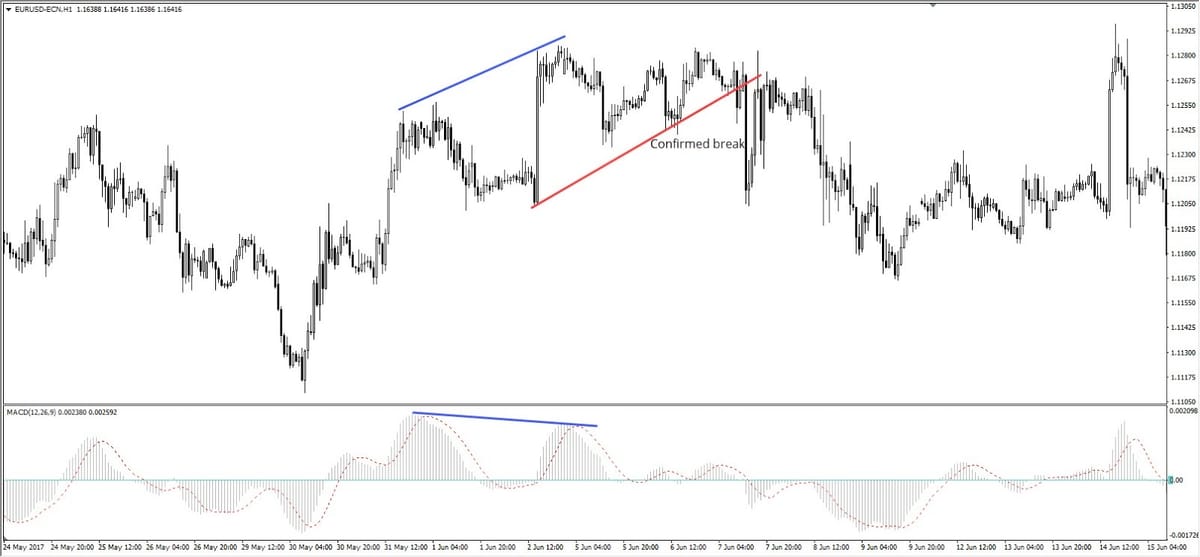
Understanding MACD
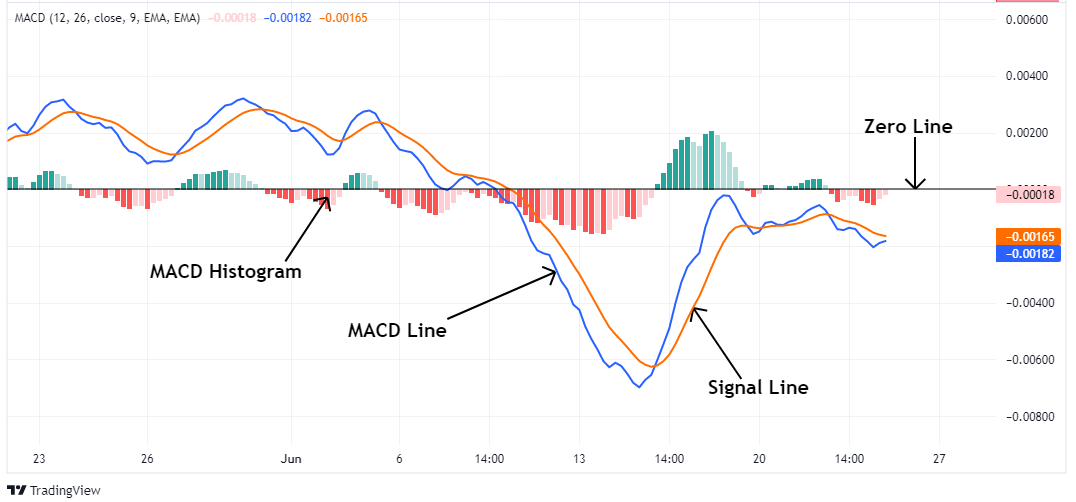
MACD stands for Moving Average Convergence Divergence. It uses two moving averages to show how momentum is changing. The MACD line is created by subtracting one average from another. A signal line, which is a slower average, helps confirm changes in direction. When the MACD line crosses above the signal line, it may mean a buy signal. If it crosses below, it could mean a sell signal.
MACD also has a histogram which are bars that show the distance between the MACD line and the signal line. Bigger bars mean stronger momentum.
This tool works best in trending markets, where price is moving in one direction for a while. It helps you stay in trades longer and spot when a trend might be changing.
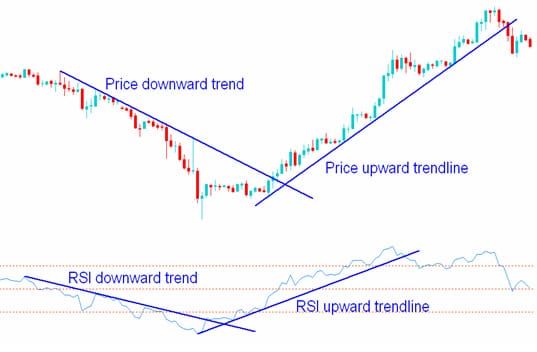
Understanding RSI
RSI stands for Relative Strength Index. It moves on a scale from 0 to 100 and measures how strong recent price changes are. If RSI goes above 70, the market might be overbought. If it falls below 30, it might be oversold. This helps traders decide if price is about to reverse.
RSI is great for range-bound markets when price is bouncing between support and resistance levels. It helps you spot when the price has gone too far and may soon go back.
How They Compare Side-by-Side
Here’s a table comparing the main features of MACD and RSI:
|
Feature |
MACD |
RSI |
|
Type of
Indicator |
Trend-following
and momentum |
Momentum
only |
|
Best For |
Trending
markets |
Range-bound
markets |
|
Key
Signal |
Line
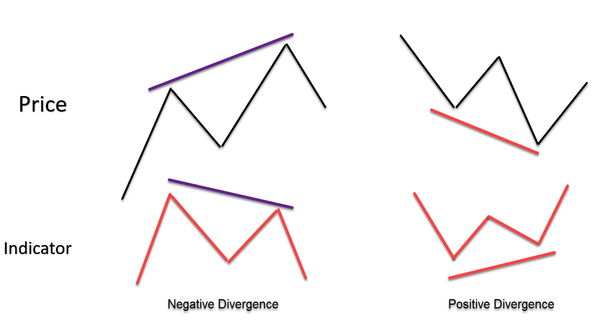
crossovers, divergence, histogram |
Overbought/oversold
levels, divergence |
|
Signal
Delay |
Slightly
delayed due to moving averages |
Reacts
faster |
|
Common
Use |
Spotting
trend changes and entry points |
Timing
reversals and corrections |
|
Extra
Tool Needed? |
Better
with price levels or volume |
Often
used with trendlines or patterns |
Which One Should You Use?
Choosing between MACD and RSI depends on your trading style. Both are great tools, but they shine in different ways. Let’s break it down.
For Trend Traders: MACD Is a Strong Choice
If you like to follow big moves like when price keeps going up or down for a while, MACD is helpful. It shows you when a trend might be starting or slowing down. For example, if the MACD line crosses above the signal line and the bars on the histogram grow taller, it often means an uptrend is beginning. You can enter early and ride the trend.
MACD is also good if you like to hold trades longer and don’t want to react to every little price move. It filters out the noise and shows the bigger picture.
For Quick Reversals: RSI Is Your Friend
If you like short trades, RSI might be better. RSI shows you when price may have gone too far, too fast. This happens when RSI hits 70 (overbought) or 30 (oversold). These levels help you spot turning points, especially when the market is moving sideways.
RSI is great for range trading, where price keeps bouncing between the same high and low levels. It’s simple, fast, and gives clear signals for timing entries.
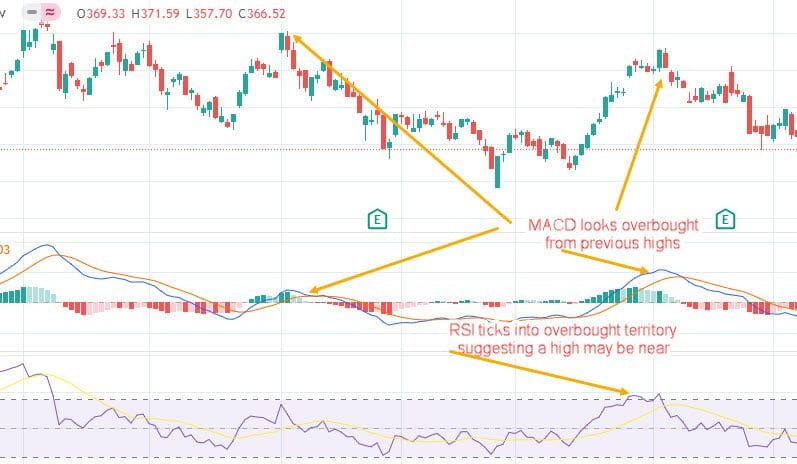
Using MACD and RSI Together
Many traders ask, “Should I use MACD or RSI?” But the truth is—you don’t have to pick just one. You can use both together. When you do, they help confirm each other’s signals and give you a clearer view of the market.
Let’s break down how they work together and why it’s a smart combo.
MACD Shows the Trend
MACD is great for showing which way the market is moving. Is the trend going up or down? That’s what MACD helps answer. If the MACD line crosses above the signal line, it means buyers may be taking control. If it crosses below, sellers may be stronger.
This helps you understand the direction of the trade whether you should be looking to buy or sell.
RSI Helps with Timing
While MACD shows the trend, RSI tells you when to enter. RSI measures how strong or weak a move is. If price is rising too fast, RSI might go above 70. That’s a warning the move could slow down. If price is falling quickly, RSI might go below 30, signaling it may bounce soon.
This is super helpful when you want to wait for a pullback before jumping in.
How to Combine the Two
Here’s how MACD and RSI work well as a team:
- Step 1: Look at MACD. If the MACD line crosses up and the histogram is growing, the trend is likely up.
- Step 2: Check RSI. If it’s between 40–50 (during an uptrend), that might be a good place to enter.
- Step 3: Wait for price to show signs of moving up again (like a bullish candle). That’s your entry signal.
This way, MACD tells you where the market wants to go, and RSI tells you when it’s safe to join.
Conclusion
MACD and RSI are both strong momentum tools. They just do different jobs. MACD helps with trend-following and spotting bigger shifts. RSI helps with short-term timing and quick trades. Try both and see which one fits your trading style. Or better yet, combine them for clearer, smarter decisions.
FAQs
1. Can I use MACD and RSI on the same chart?
Yes! Many traders use both at once to confirm signals. MACD shows trend strength, while RSI shows overbought or oversold conditions.
2. Which indicator is better for beginners?
RSI is simpler and easier to read, making it a great first step for new traders.
3. Is MACD good for short-term trading?
MACD works better for longer trends. It can still be used for short trades, but signals may be slower than RSI.
4. Can these indicators give false signals?
Yes, like any tool, MACD and RSI can be wrong sometimes. It’s best to use them with support/resistance or chart patterns.
5. What timeframes are best for MACD and RSI?
MACD is usually better on 1-hour and above. RSI works well on all timeframes, but use longer charts for stronger signals.