MACD Divergence Explained: Spotting Reversals Before They Happen
MACD divergence is a powerful way to spot market turning points before they happen. In this guide, you’ll learn how to recognize divergence, time your trades smartly, and combine tools for better success, even if you're just starting out.


"The trend is your friend—until it ends." — Anonymous
MACD divergence is a simple way to spot when the price might turn around. It shows when the price is going one way, but MACD is going the other. This means the trend is getting weak. When that happens, a reversal may be coming. In this post, you’ll learn what MACD divergence is, how to spot it, and how to use it to trade better.
Key Takeaways
- Divergence means price and MACD are not moving the same way.
- Bullish divergence can mean price might go up.
- Bearish divergence can mean price might go down.
- Divergence shows early warning signs.
- You need to wait for confirmation before entering a trade.
What Is MACD Divergence?
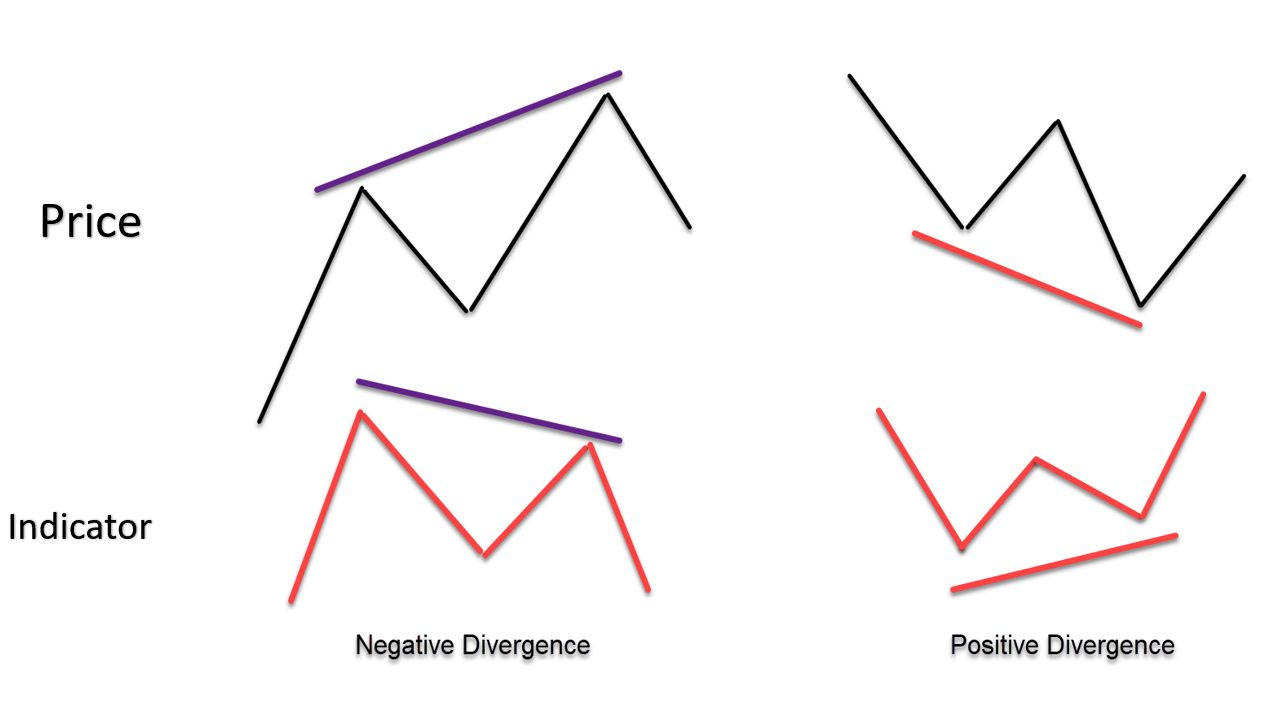
MACD divergence happens when price makes a new high or low, but MACD does not follow. This tells you something is wrong with the trend.
- Bullish divergence = price makes a lower low, but MACD makes a higher low. This can mean the downtrend is ending.
- Bearish divergence = price makes a higher high, but MACD makes a lower high. This can mean the uptrend is losing strength.
Divergence is like a warning light on your dashboard. It tells you to pay attention.
How to Spot MACD Divergence
Spotting MACD divergence takes practice, but it becomes easier once you know what to look for. Divergence happens when the price and the MACD line are telling you different stories. The key is to compare the highs and lows of price with the highs and lows of MACD.
Step 1: Look for Price Swings
Start by checking your chart. Identify clear highs and lows in the price. These are the swing points where the market moves up and then down, or down and then up. Mark the most recent two highs or two lows with a trendline or visually note them.
- If price is going up, focus on the highs.
- If price is going down, focus on the lows.
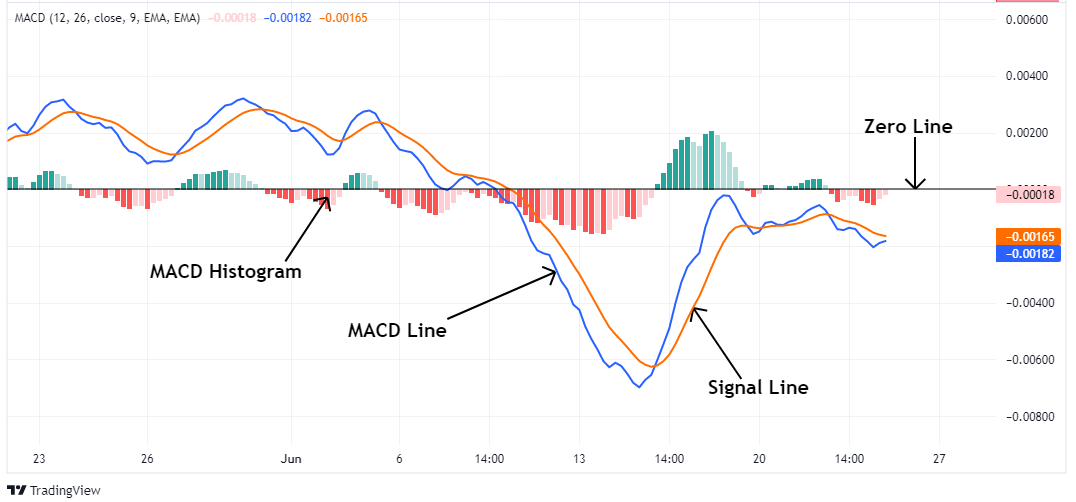
Step 2: Compare with MACD Line
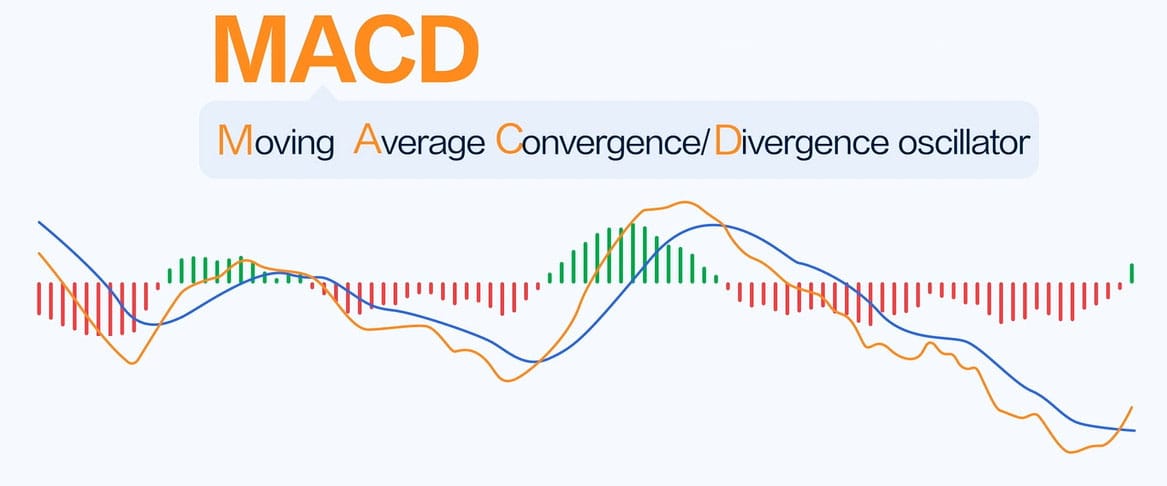
Next, look at the MACD line (usually the blue line) under your price chart. It moves up and down like price does, but sometimes it tells a different story.
- For bearish divergence, price makes a higher high, but MACD makes a lower high.
- For bullish divergence, price makes a lower low, but MACD makes a higher low.
This mismatch means momentum is slowing down, even though the price keeps pushing. It’s a warning that the current trend might be getting weak.
Step 3: Use the Histogram for Extra Clarity
The MACD histogram (the bars that go above and below the zero line) can also help. If the histogram shrinks while price makes a new high or low, it might confirm the divergence.
- Shrinking green bars during higher price = bearish divergence
- Shrinking red bars during lower price = bullish divergence
This shows that the strength behind the move is fading, even if price hasn't reversed yet.
Step 4: Confirm with a Candle or Pattern
After spotting the divergence, don’t jump into a trade right away. Look for a clear price action signal that confirms the change.
Examples include:
- Pin bars
- Engulfing candles
- Doji candles
- Breaks of small trendlines or support/resistance
When you see a strong reversal candle after divergence, it’s a sign that price might now follow what MACD hinted at.
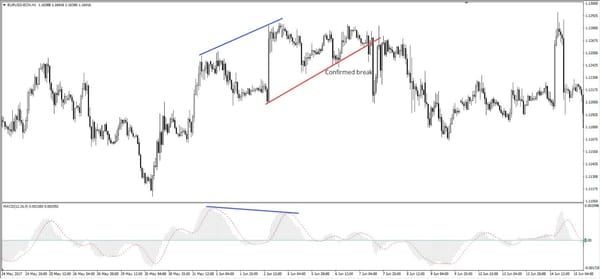
Example:
Let’s say EUR/USD made a new high at 1.0920. But MACD didn’t go higher, it peaked earlier at the last high. That’s bearish divergence. A few candles later, a bearish engulfing candle forms. That’s your confirmation. Now, you can plan a short trade with a stop above the high.
MACD Divergence Signals
|
Divergence Type |
What Price Does |
What MACD Does |
What It Means |
|
Bullish Divergence |
Lower Low |
Higher Low |
Trend might go up soon |
|
Bearish Divergence |
Higher High |
Lower High |
Trend might go down soon |
When to Trade MACD Divergence
Just spotting MACD divergence isn’t enough, you also need to know when it’s safe to trade it. Divergence is a warning sign, not a green light. Acting too early or without confirmation can lead to losses. Here’s how to do it the right way.
Wait for a Price Signal
Before you enter a trade, wait for price to confirm what MACD is telling you. MACD divergence tells you the trend might be weak, but you still need to see price change direction.
Look for clear signs like:
- A reversal candle, such as a pin bar or engulfing candle.
- A break of a trendline.
- Price bouncing off a support or resistance level.
Use Important Levels for Extra Strength
Divergence works best when it happens near key levels. These are places where price often reacts, such as:
- Support or resistance zones
- Previous highs or lows
- Round numbers (like 1.1000 or 150.00)
For example, if price is near support and MACD shows bullish divergence, it’s a good sign the downtrend might end soon. If you're near resistance and see bearish divergence, be ready for a possible drop.
Use a Stop Loss and Manage Risk
Even the best MACD divergence setup can fail. That’s why you must protect your trade.
Here’s how:
- For bullish divergence, place your stop loss below the recent low.
- For bearish divergence, place your stop above the recent high.
Combining Divergence with Other Tools
MACD divergence can be powerful on its own, but it works even better when you combine it with other tools. Doing this helps confirm your trade idea and lowers the chance of making a mistake. Let’s look at a few ways you can make divergence stronger by using it with other popular tools.
Support and Resistance Zones
Support and resistance are key levels where price often bounces or stops. These areas can make your divergence setup much more reliable. For example, if you see bullish divergence forming near a known support level, where price has bounced before, it’s a strong clue that the price might go up again. The same is true for bearish divergence near resistance. If MACD is warning of a slowdown while price is at a resistance zone, a drop could follow. Using these levels gives you a smarter place to enter trades or set stop losses.
Candlestick Patterns for Confirmation
Once you spot divergence, the next step is to wait for price to agree. One way to do this is by watching for reversal candlestick patterns. Patterns like pin bars, engulfing candles, or even a doji can help confirm the idea that the market is about to turn. For instance, if MACD shows bearish divergence and a bearish engulfing candle forms at the same time, this gives you a stronger reason to enter a sell trade. The candle acts like a “yes” signal that supports what the MACD is already telling you.
Trendlines and Moving Averages
Another tool to use with divergence is a trendline or a moving average. These help you track the market’s direction. If MACD divergence shows up just as price breaks below a trendline or crosses a moving average, it can mean the trend is really starting to shift. This added signal helps you feel more confident that the reversal is real, not just a small pullback or fake-out.
Volume as a Final Clue
Sometimes, price shows divergence but doesn’t move much afterward. That’s when volume can help. If the divergence is followed by a sudden increase in trading volume, it often means bigger traders or institutions are stepping in. This gives extra power to the setup. It shows that real money is moving the market, and you may want to follow their lead.
Conclusion
MACD divergence is a great way to find when the trend may be changing. It gives you an early clue before the price moves. But it’s not magic. You must wait for confirmation and use good risk management. Combine it with other tools, and it becomes a smart part of your trading plan.
FAQs
1. Can I use divergence on any chart?
Yes. You can use it on stocks, forex, crypto or any chart with MACD.
2. What time frame is best?
1-hour, 4-hour, or daily charts are best for spotting good divergence signals.
3. Is MACD divergence always right?
No. It gives clues, not promises. Always use a stop-loss and wait for price to agree.
4. Can I use it with other indicators?
Yes. Use it with support/resistance, RSI, or candlestick patterns to get better signals.
5. How do I know if a divergence is strong?
It’s stronger if it happens at a key level or with a reversal candle pattern.