How to Use Volume Profile in Day Trading
Volume Profile is a powerful tool that shows where trading activity happens on the chart. In this guide, you’ll learn how day traders use Volume Profile to find support, resistance, breakout zones, and more.


"Great things take time. Be patient, stay consistent, and trust the process." — Unknown
When you look at a price chart, you mostly see time and price. But there’s another key part of trading that often goes unnoticed: volume. Volume tells you how much trading activity is happening at different price levels. That’s where Volume Profile comes in. It gives traders a clear view of where buyers and sellers are most active. For day traders, this tool can offer major advantages in spotting key zones and planning smart entries and exits. In this guide, we’ll explore how to use volume profile in day trading, explained in the simplest way possible.
Key Takeaways
- Volume profile shows where trading volume happened on a chart, not just when.
- It helps you find areas of interest like high volume nodes (HVNs) and low volume nodes (LVNs).
- Traders use it to identify support and resistance, breakout zones, and retest opportunities.
- Volume profile works best with a good strategy and clean risk management.
- It’s ideal for day traders who want more than just indicators based on time.
What Is Volume Profile?
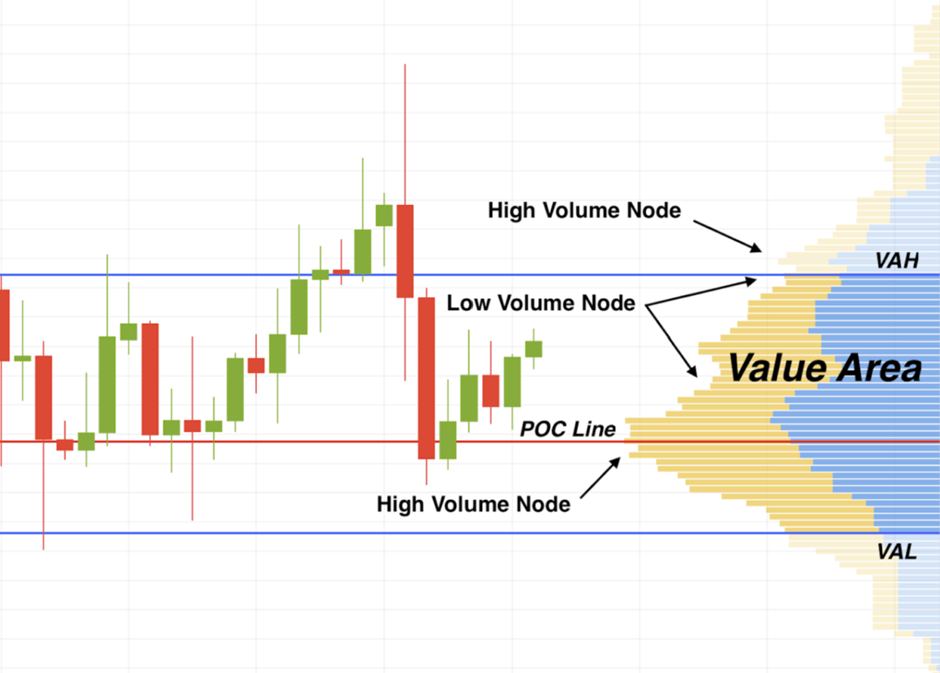
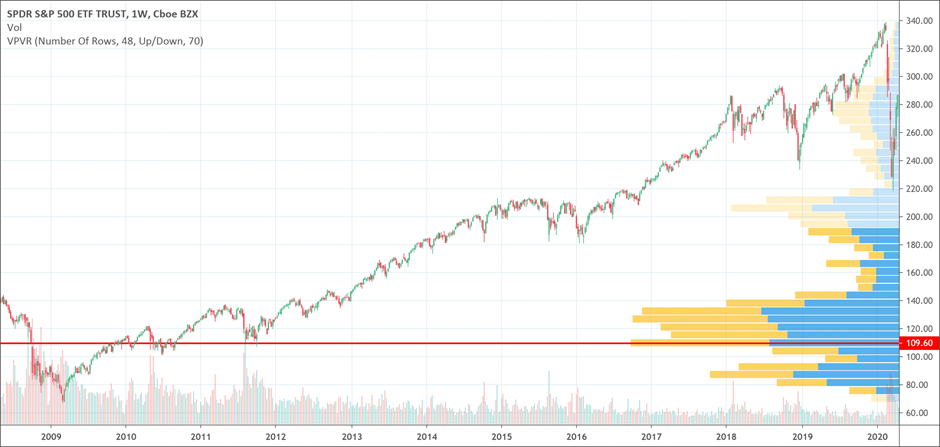
Volume Profile is a tool that shows how much trading activity happened at each price level during a certain time period. It doesn’t show volume by candle or bar. Instead, it stacks all the trading volume on the side of the chart, lined up with price. This helps traders see exactly which price levels had the most (or least) buying and selling.
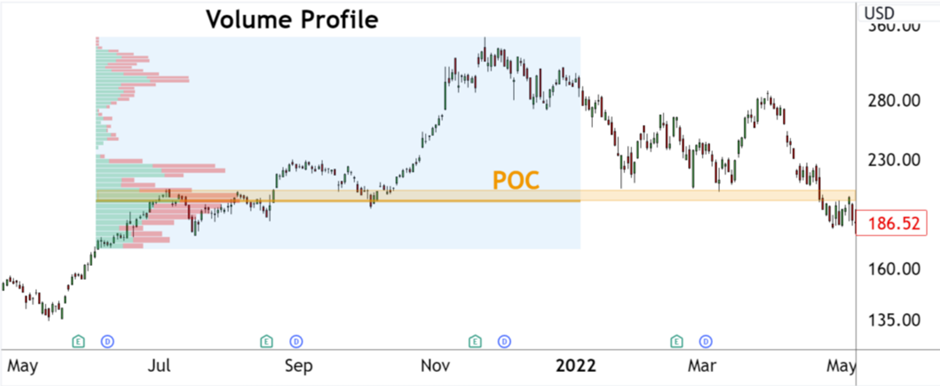
One of the most important parts of Volume Profile is the Point of Control (POC). This is the price level with the most volume. It often acts like a magnet where price returns or reacts.
Another key feature is the Value Area (VA), which includes about 70% of the total volume for the period shown. Price often moves inside this range or bounces off its edges.
Why Day Traders Like Volume Profile
Volume Profile is a favorite among day traders because it offers a detailed view of where key trading activity happens. Instead of relying on guesswork or lagging indicators, traders use volume data to better understand price behavior in real time. Let’s break down the specific reasons why it’s so useful.
Spotting High-Interest Price Levels
The main reason day traders turn to Volume Profile is that it reveals exactly which price levels have the most trading volume. These areas—like the Point of Control (POC) or High Volume Nodes (HVNs)—often act as support and resistance zones. When price approaches these levels, it tends to either bounce or break with force, giving traders important clues for entries, exits, or stop-loss placement.
Planning Precise Entries and Exits
Because Volume Profile shows how much volume occurred at each price level, it helps traders avoid random entries. For instance, if price returns to a value area low with declining volume, a trader may consider a long entry. Similarly, if price breaks above a high-volume zone and pulls back with low resistance, that might be an ideal place to re-enter. This approach allows for well-defined setups with clear risk levels—especially valuable during volatile market hours.
Filtering Out Fakeouts and Weak Moves
Traditional indicators sometimes fail during fast moves or low-volume periods. Volume Profile gives an edge by showing whether a breakout or breakdown is supported by strong volume. If price breaks above resistance but there’s little volume behind it, traders may treat it as a fakeout. On the other hand, a breakout that moves through a low volume area quickly might signal a strong move with little friction.
Confidence Through Confirmation
Volume Profile adds confidence to a trade by acting as a confirmation tool. Instead of relying only on patterns or candlestick shapes, traders use volume levels to validate whether the market is truly accepting a price or rejecting it. This reduces emotional decisions and leads to more disciplined, data-driven trading.
Key Elements of Volume Profile
Let’s look at some common parts of a volume profile chart and what they mean:
|
Element |
Description |
|
Point of Control (POC) |
Price level with the
highest traded volume. Acts like a magnet for price. |
|
High Volume Node (HVN) |
Area with a lot of activity. Often
used as support or resistance. |
|
Low Volume Node (LVN) |
Area with very little
activity. Price moves through quickly or avoids it. |
|
Value Area (VA) |
Range that holds about 70% of
volume. Important for judging fair price zones. |
How to Use Volume Profile in Your Trades
Volume Profile becomes powerful when combined with good market structure. For example, if price breaks above the value area and then returns to retest it, many traders will look for an entry there. That area becomes a "volume-backed support zone."
If price moves through a low volume area quickly, that can signal a strong move without much resistance. These zones often act like "volume gaps," where price just slices through.
The Point of Control is also useful. If price is near the POC, it may stall or bounce there. Many day traders use it as a take-profit or re-entry zone.
You don’t need a lot of indicators when you use volume profile. It often works best with simple tools like support/resistance lines and trend structure.
Two Smart Ways to Use Volume Profile
Volume Profile becomes especially powerful when you understand how price reacts around specific volume levels. Two of the most reliable and widely used methods involve watching how price interacts with the Value Area High/Low (VAH/VAL) and the Point of Control (POC). Let’s explore each in more detail:
Retests of Value Area High (VAH) and Value Area Low (VAL)
The Value Area High and Low represent the upper and lower boundaries of where roughly 70% of the trading volume occurred. When price breaks above the VAH or below the VAL, it suggests a potential shift in market interest.
A breakout followed by a retest of these levels is a powerful trading opportunity. Here's how this plays out:
- Bullish Example: Price breaks out above the VAH, suggesting buyers are stepping in with strength. If price then pulls back to the VAH and holds that level (especially with a bullish candle or wick rejection), it often signals a continuation upward. This becomes a high-probability long entry, with the VAH acting as new support.
- Bearish Example: Price drops below the VAL and then returns to retest it from underneath. If price hesitates or rejects at the VAL, it confirms resistance and can offer a clean short entry with a tight stop.
What makes this setup effective is the defined structure it gives: you know your entry trigger (the retest), your invalidation level (break back inside the value area), and your potential target (POC or opposite edge of the value area). It’s a method that gives day traders a mechanical and repeatable edge.
Reactions Around the Point of Control (POC)
The POC is the price level with the highest volume traded during the session or selected time period. Think of it as the “fair price” or the area of agreement between buyers and sellers. Because of this, it often acts like a magnet, pulling price toward it or causing price to stall or reverse.
There are two main ways to trade around the POC:
- Bounce or Rejection: If price approaches the POC and shows clear hesitation—like small-bodied candles, wicks, or sudden drops in volume—it often leads to a short-term bounce or reversal. Traders might enter a trade away from the POC in the direction of the prior move, placing stops just beyond it.
- Break and Hold: If price breaks through the POC with strong volume and closes above or below it, it can signal a shift in control. This breakout may set up a continuation trade, especially if price retests the POC and holds on the other side.
The key here is context: if the market is ranging, the POC is more likely to act like a magnet. If the market is trending, the POC can become a springboard for continuation.
Common Mistakes to Avoid
- Using volume profile on low-volume assets like penny stocks.
- Ignoring overall market direction or news events.
- Placing trades too far from the POC or value area without confirmation.
Volume Profile is not a magic tool. It works best when used with other trading basics: clear risk management, defined setups, and a solid trading plan.
Conclusion
Volume Profile helps you read the story behind price action. Instead of only looking at where price has been, you learn how many trades happened at each level. This gives deeper insight into where traders are interested and where price might move next. It’s a powerful tool for day traders who want to add structure and confidence to their trades. When used with patience and practice, Volume Profile can become one of the most valuable tools in your trading toolbox.
Frequently Asked Questions (FAQs)
1. Is volume profile better than regular volume bars?
Yes, because volume profile shows where trades happened, not just when. This gives more useful insight into support and resistance zones.
2. Can I use volume profile for swing trading too?
Yes. While this article focuses on day trading, swing traders also use volume profile on higher timeframes like 4-hour or daily charts.
3. What is a good platform for using volume profile?
TradingView, NinjaTrader, and Sierra Chart all offer solid volume profile tools. Some brokers also include them.
4. Do I need to pay for volume profile tools?
Some platforms offer it for free, but most advanced volume profile features are part of paid plans. It’s often worth the upgrade.
5. How do I know which level is most important?
Start by watching the Point of Control and Value Area levels. They’re usually the most active and give the clearest price reactions.