How to Spot Liquidity Grabs Before Price Takes Off
Liquidity grabs often fake traders out before big moves begin. In this guide, you’ll learn how to spot stop hunts, identify key price zones, and trade smarter by waiting for the real move. Perfect for beginner and intermediate traders looking to avoid traps and improve timing.


Ever placed a trade right before price dropped, only to watch it shoot up after you got stopped out? That might not be bad luck, you may have just been caught in a liquidity grab. These moves are common in the market and often happen right before a big trend starts. In this article, we’ll break down what liquidity grabs are, how to recognize them, and how to use them in your favor. Don’t worry, everything is explained in simple, clear terms perfect for beginner and intermediate traders.
Key Takeaways
- A liquidity grab is when price moves into areas where lots of stop-losses or pending orders are sitting, often before a major move.
- Big players (like institutions) use these areas to enter large trades with better prices.
- These grabs usually fake traders out before reversing and continuing the real trend.
- You can learn to spot the signs of a grab using price action and structure.
- Recognizing liquidity grabs can improve entries and reduce fakeouts.
What Is a Liquidity Grab?
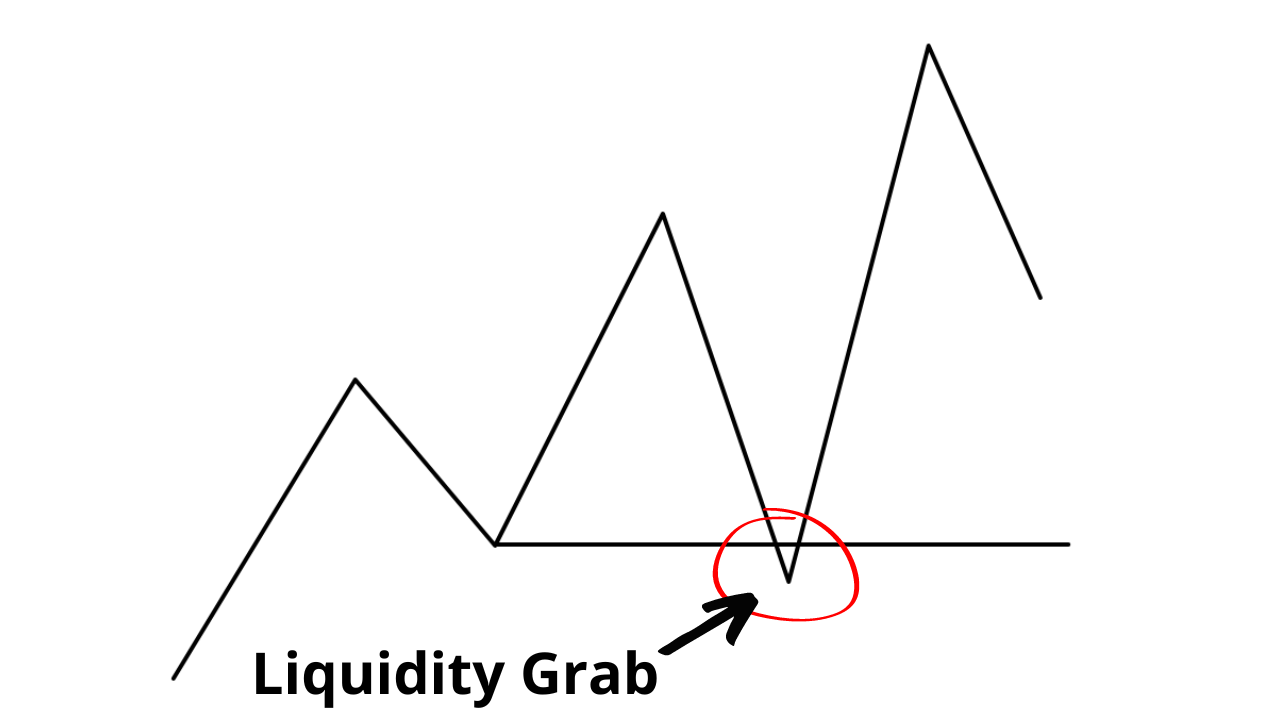
A liquidity grab happens when price quickly moves into a zone full of stop-losses, limit orders, or breakout traders’ entries. These areas are like pools of easy money for large traders who need big volume to enter or exit trades. When the market hits these zones, it can trigger stop-losses or trap traders into bad positions, causing a sudden spike or drop.
Right after that, the price often reverses and continues in the opposite direction, leaving many traders behind or in a losing trade. These moves are sometimes called stop hunts or fakeouts.
Why Do Liquidity Grabs Happen?
The main reason is simple: big institutions and smart money need liquidity. They can’t place huge trades at random prices as they need a lot of buyers or sellers to match their orders. By driving price into zones where retail traders have their stops or breakout orders, they can create the volume they need.
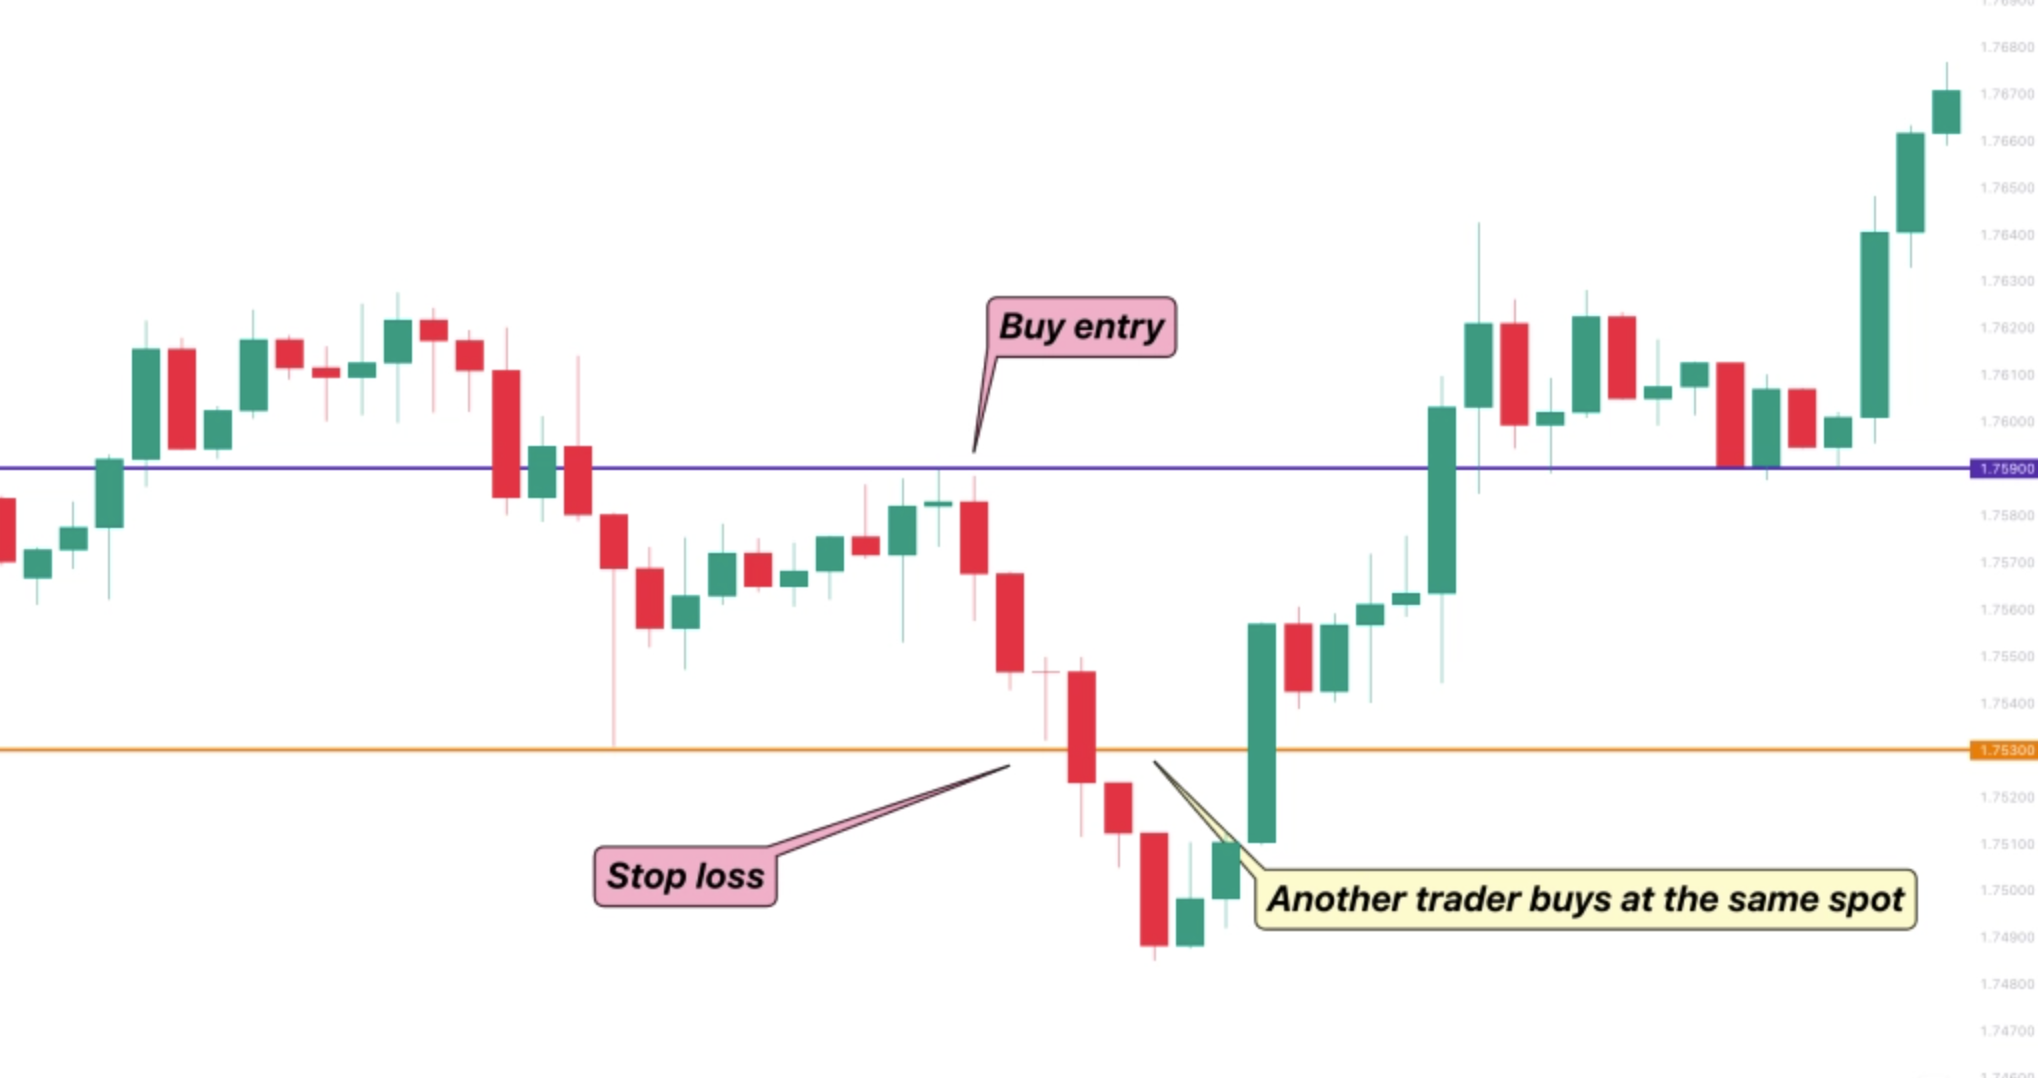
Imagine this: lots of traders put their stop-losses below a recent low. A big trader pushes price just below that level, hits the stops, and then buys at a great price. Price quickly bounces back up, leaving stop-loss traders frustrated and confused.
Where Do Liquidity Grabs Usually Happen?
Liquidity grabs often show up in specific areas, such as:
- Below equal lows: When two or more lows are at the same level, traders often place stops just below. That makes it a hot spot for grabs.
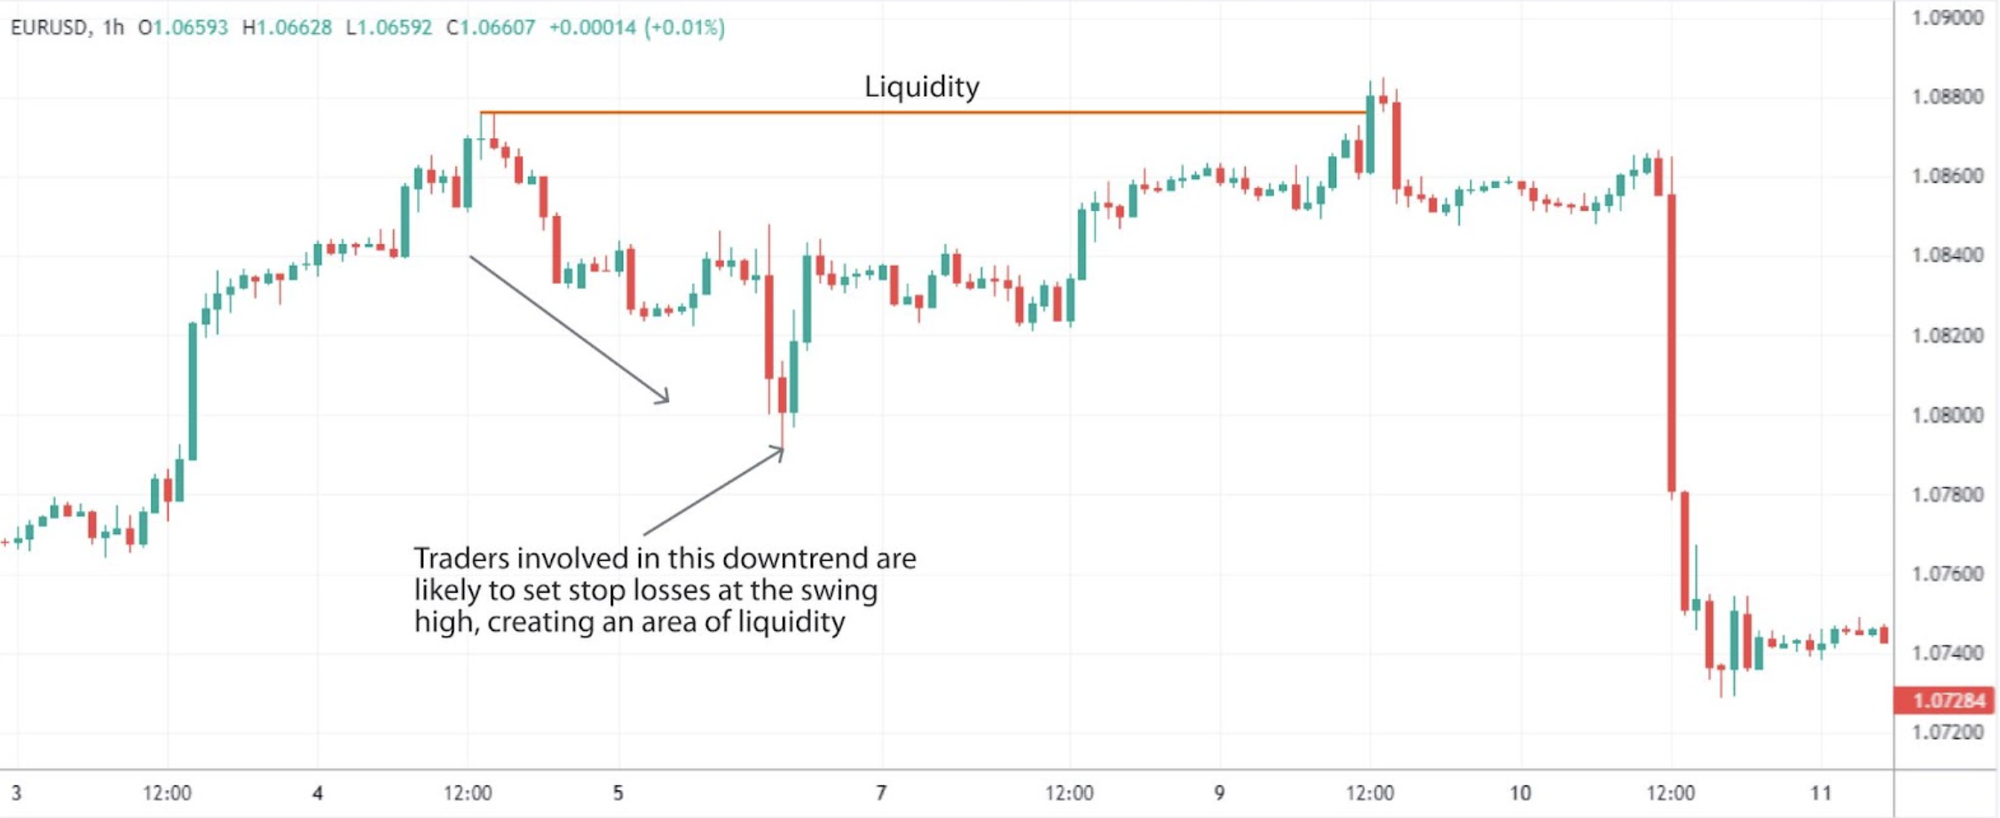
- Above obvious highs: Breakout traders enter when price breaks resistance. Smart money can push price just above, fill orders, and reverse.
- Near session openings: Big moves at London or New York opens often start with a fakeout before the real direction.
These areas are easy to find if you pay attention to recent highs and lows, trendlines, or zones with lots of wick rejections.
How to Spot a Liquidity Grab in Real Time
Liquidity grabs are often sneaky, but they usually leave behind certain clues—especially for traders who are paying attention to price action and structure. Here’s how to recognize them as they unfold:
Strong Wick Rejection
One of the most obvious signs of a liquidity grab is a long wick, especially on higher timeframes like 15-minute, 1-hour, or 4-hour candles. This happens when price briefly spikes into a key zone (such as above a recent high or below a key low), grabs liquidity, then quickly snaps back—leaving behind a wick and a small candle body.
What it means
The market entered a liquidity pool (where stop-losses or breakout orders were stacked), triggered those orders, and then rejected the level once the big players got filled.
Example
Price breaks below yesterday’s low with a big red candle, then quickly moves back above the low before the candle closes. That long lower wick tells you buyers stepped in hard—likely the smart money buying up retail stop-losses.
What to do
Wait for confirmation (such as a bullish candle closing back inside structure), then consider entering in the opposite direction with your stop just beyond the wick.
Break and Return
This is when price appears to break a support or resistance level, giving the impression of a breakout—but then closes back inside the range within the same or next few candles. This is sometimes called a “deviation” or “false break.”
What it means
The breakout move was used to bait breakout traders or trigger stop-losses. Once those orders are filled, the market no longer has momentum in that direction and returns to the original range.
Example
Price breaks above a consolidation zone (say 4+ candles stuck sideways), pushes up 20 pips, then pulls back and closes below the breakout level. This tells you the breakout may have been a trap.
What to do
After the return, you can watch for a reversal pattern (like a bearish engulfing candle) to enter in the opposite direction. Set stops just outside the high of the fake breakout.
Fast Push With No Follow-Through
Sometimes liquidity grabs happen quickly and aggressively. You’ll see a large candle or sudden move during a key session (like the London or New York open), but the market doesn’t keep pushing in that direction. Instead, it stalls, pauses, or reverses soon after.
What it means
Big players pushed the market fast to trigger orders, collect liquidity, then reversed once they had the positions they wanted. If there's no strong follow-up volume or continuation, it's often a grab.
Example
At the start of the NY session, price spikes up 30–40 pips in 1–2 candles, clears a previous high, then the next candle is small or shows rejection. Volume drops. This could be a sign of a stop hunt before a reversal.
What to do
Don't chase the move. Wait for signs of reversal or consolidation, then look for entries back toward the opposite direction. Add confirmation with things like divergences, volume profile, or a change in market structure.
Here’s a table to help you recognize the signs:
|
Situation |
Possible Liquidity Grab Sign |
|
Price spikes below key low |
Quick bounce back with
long lower wick |
|
Break of resistance fails |
Price returns below level within
few candles |
|
Big candle at session open |
Followed by slow
reversal the other way |
How to Trade Around Liquidity Grabs
Learning how to trade after a liquidity grab can give you cleaner entries, better risk-reward setups, and fewer false breakouts. Below are several key concepts to help you approach these trades with confidence and structure.
Don’t Chase the Breakout
The first rule is patience. Instead of entering when price breaks a key level (like a support or resistance line), wait for the stop run to occur. This means letting price break the level, sweep stop-losses or trigger breakout entries, and then watch what happens next.
Most failed trades happen when traders chase the first breakout move. But in many cases, that move is just a trap, and price reverses once the market grabs enough liquidity. By waiting for the grab to complete, you can avoid being on the wrong side of the market.
Look for Price Rejection and Reversal Signs
Once price has run stops, the next step is to watch for confirmation. This usually appears in the form of price action signals—such as:
- A bullish engulfing candle after a sweep of lows
- A pin bar or long wick rejecting the key zone
- A change in market structure on a lower timeframe
For example, if price drops below support but quickly snaps back above, that’s a possible signal that the liquidity grab is complete. Once price closes back above that level and holds, it may be time to enter long, placing your stop just below the wick that swept the lows.
This method often gives you a tight stop and a clean entry, especially when paired with a logical take-profit target like the opposite side of the range or the recent high.
Use Confluence from Tools like Volume Profile and SMC
Liquidity grabs are more powerful when they align with other technical tools. Many traders combine this concept with:
- Volume Profile: If a grab occurs near the Point of Control (POC), or just outside the Value Area High/Low, it signals that smart money may have taken control.
- Smart Money Concepts (SMC): Watch for a Break of Structure (BOS) or Change of Character (CHOCH) after the sweep. These indicate a likely reversal.
- Fibonacci Retracement Zones: A grab around the 61.8% or 78.6% level may offer higher confluence.
Target Clean Risk-to-Reward Setups
Liquidity grabs are ideal for finding low-risk, high-reward trades. Since the stop-loss is placed just beyond the wick of the grab, and the move often targets a full range reversal or trend continuation, the reward can be 2x–4x the risk or more.
For instance, after a sweep below support and a return back inside the range, your take-profit could be:
- The opposite range high
- A previous swing point
- A major resistance zone or VWAP level
Be Aware of Market Context
Liquidity grabs work best when they appear in context. Ask yourself:
- Is the market trending or ranging?
- Are we at a session open (like London or NY)?
- Was there a news release or macro event nearby?
These conditions matter. For example, during the New York open, fast spikes and liquidity sweeps are common. In those moments, being patient and waiting for structure to shift is more reliable than guessing the direction in advance.
Conclusion
Liquidity grabs are one of the key tricks used by smart money to move the market. Learning to spot these moves can keep you out of bad trades and help you get in with the big players. Instead of being shaken out, you’ll start to see these fakeouts as opportunities. With practice, liquidity grabs can become one of your favorite setups for clean, high-probability entries.
Frequently Asked Questions (FAQs)
1. Are liquidity grabs the same as stop hunts?
Yes, many traders use the terms to mean the same thing—a quick move to take out stop-losses before price reverses.
2. Can I use indicators to spot liquidity grabs?
Most liquidity grabs are better spotted with price action, but tools like Volume Profile or sessions indicators can help.
3. Do grabs always lead to reversals?
Not always. Sometimes the grab clears liquidity, then the trend continues. That’s why context matters.
4. Should I trade the breakout or the reaction?
Waiting for the reaction after a fakeout is often safer than chasing the initial breakout.
5. How can I practice spotting liquidity grabs?
Look back at charts and mark major highs/lows. Then see how price behaved when those areas were broken. Practice makes it easier to see live.