How to Read Candlestick Patterns Like a Pro: Smart Guide for Beginners
Unlock the secrets behind candlestick patterns. Learn how to identify reversals, trends, and trade opportunities using this visual trading method.

“Successful people do what unsuccessful people are not willing to do. Don’t wish it were easier; wish you were better.” — Jim Rohn
Reading candlestick patterns is one of the most powerful skills a trader can develop. Whether you're day trading stocks, analyzing crypto charts, or managing swing trades, candlesticks help you visually interpret market psychology in real time. In this guide, we’ll walk you through everything you need to know to recognize and use candlestick patterns effectively in your trading strategy.
What Is a Candlestick Chart?
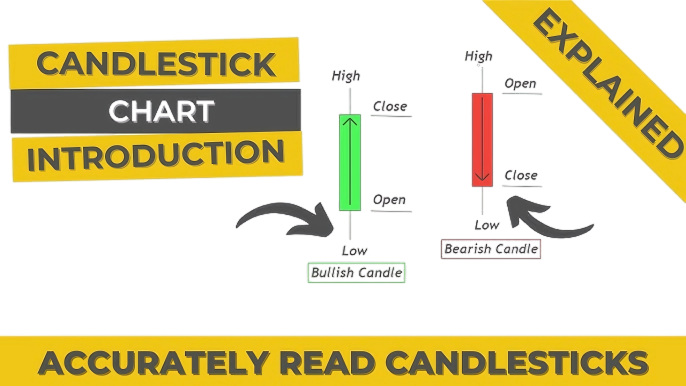
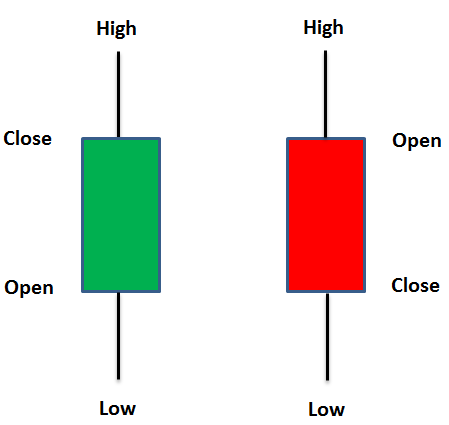
A candlestick chart is a type of financial chart used to describe price movements of a security, derivative, or currency. Each candlestick provides four essential pieces of information:
- Open price
- Close price
- High price
- Low price
Candlesticks form patterns over time that traders use to make predictions about future price direction.
Anatomy of a Candlestick
Each candlestick consists of a body and shadows (or wicks):
- Body: The range between the open and close.
- Wick (or shadow): The high and low points during the timeframe.
- A green candle (or white, depending on your chart) shows that price closed higher than it opened.
- A red candle (or black) indicates price closed lower than it opened.
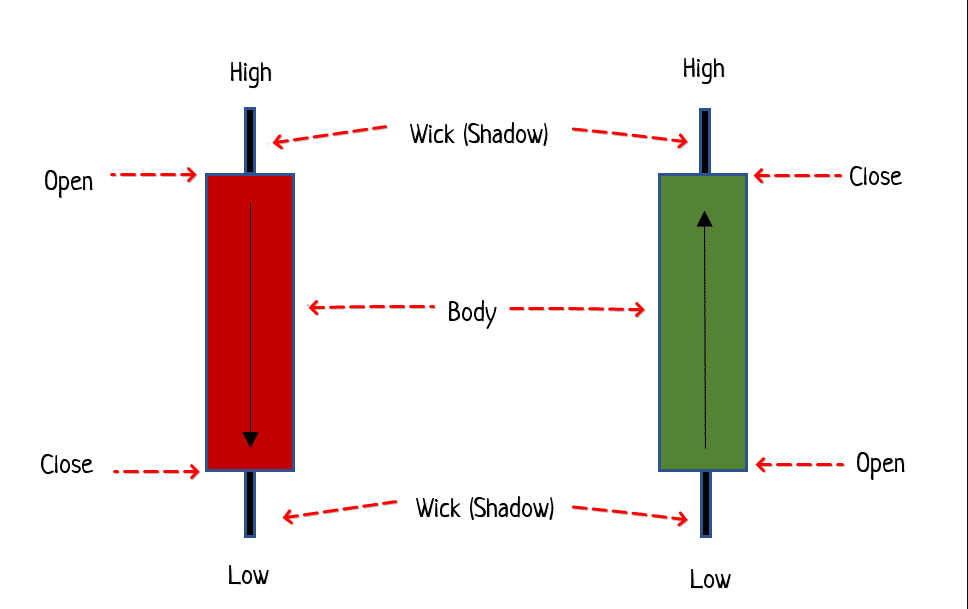
Understanding the anatomy is critical because it helps you spot patterns that suggest bullish or bearish pressure.
Why Candlestick Patterns Matter
Candlestick patterns give insight into market sentiment. They show the battle between buyers and sellers, allowing traders to spot reversals, breakouts, and continuations.
With the right interpretation, candlestick patterns can help you:
- Time entries and exits
- Set tighter stop losses
- Avoid emotional trades
- Validate technical indicators
Common Bullish Candlestick Patterns
1. Hammer
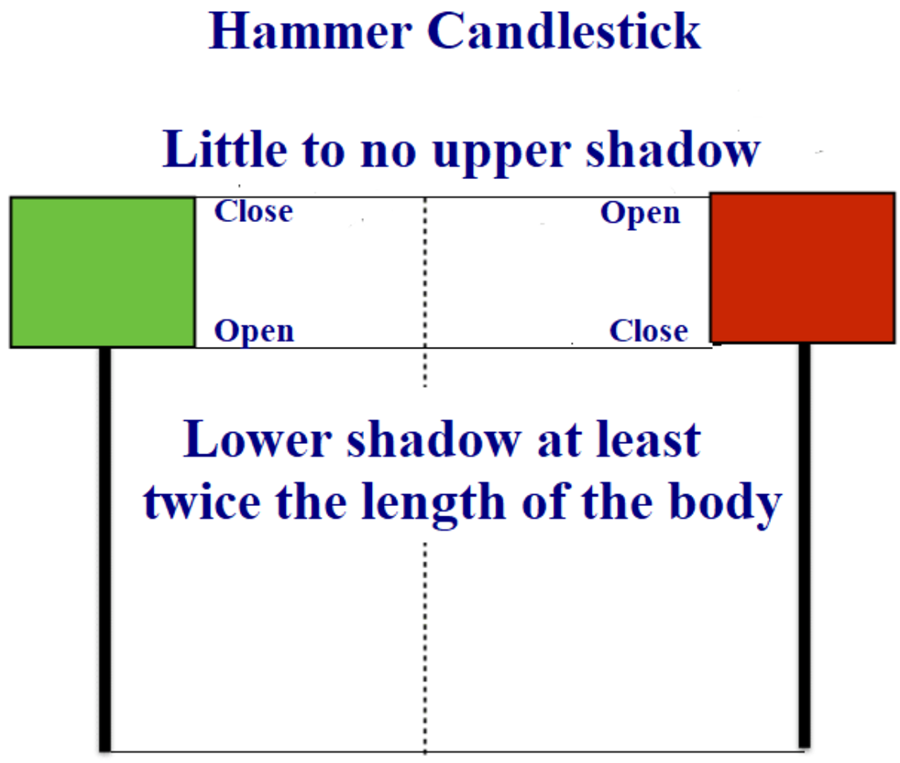
- What it means: Potential reversal from downtrend.
- Features: Small body, long lower wick, little to no upper wick.
- Tip: Look for it after a decline with volume confirmation.
2. Bullish Engulfing
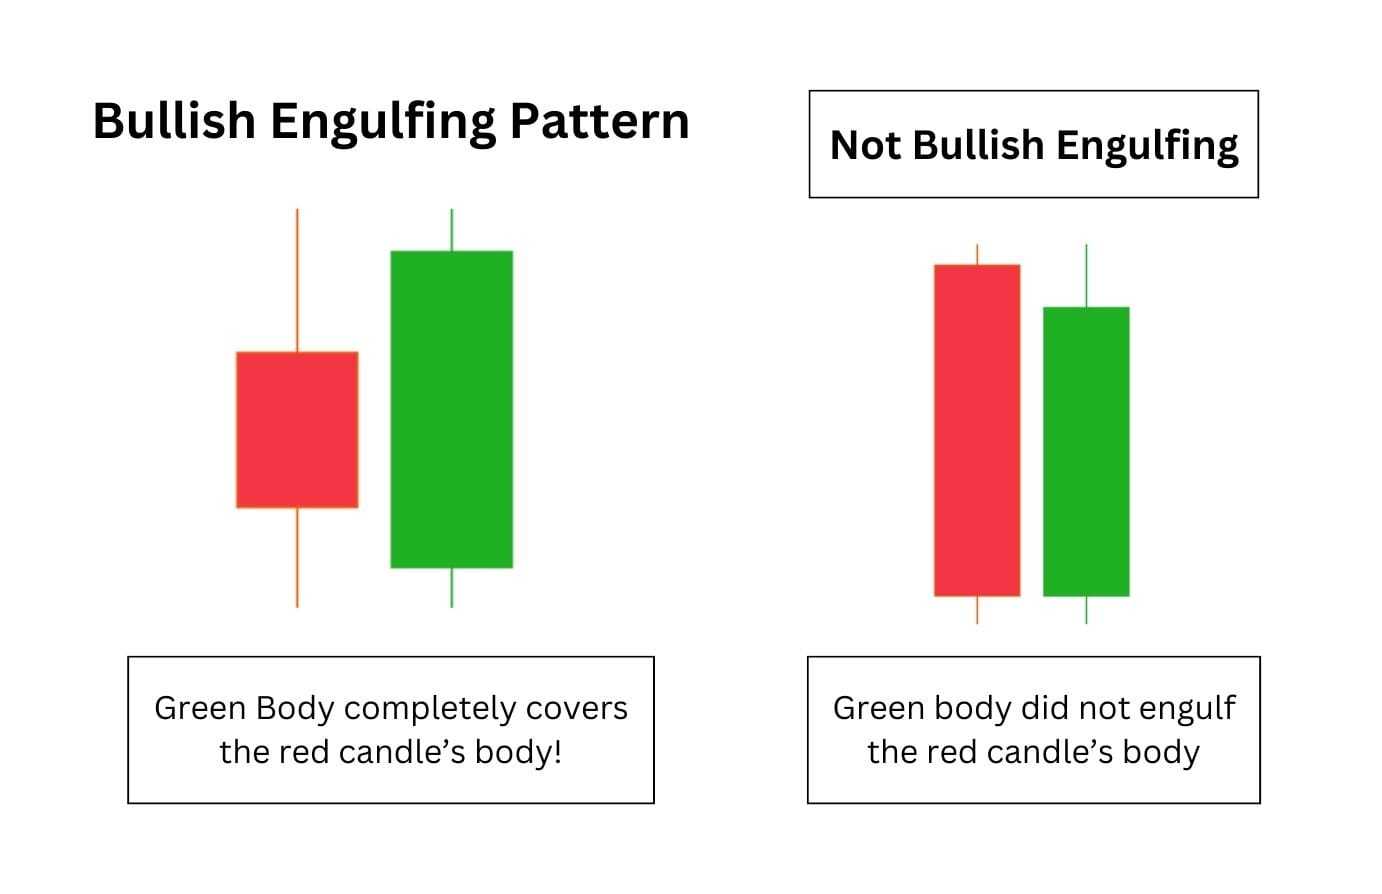
- What it means: Strong reversal signal.
- Features: Small red candle followed by a large green candle that fully engulfs the previous body.
*Tip: Watch for this at support levels.
3. Morning Star

- What it means: Bullish trend reversal over 3 candles.
- Features: One large red candle, one small-bodied candle (indecision), followed by a large green candle.
- Tip: Reliable when followed by strong volume.
4. Piercing Pattern
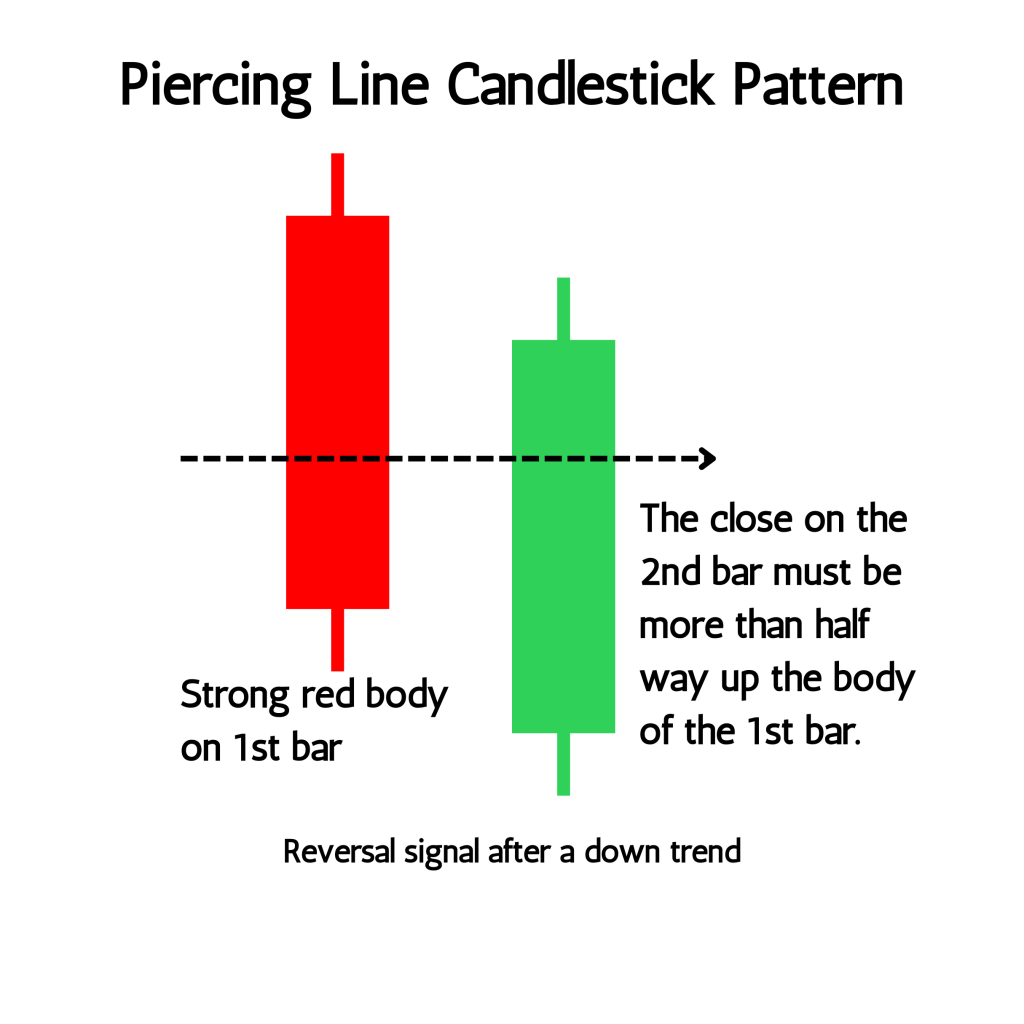
- What it means: Buyers are regaining control.
- Features: Red candle followed by green candle that opens below but closes above the midpoint of the red candle.
5. Three White Soldiers
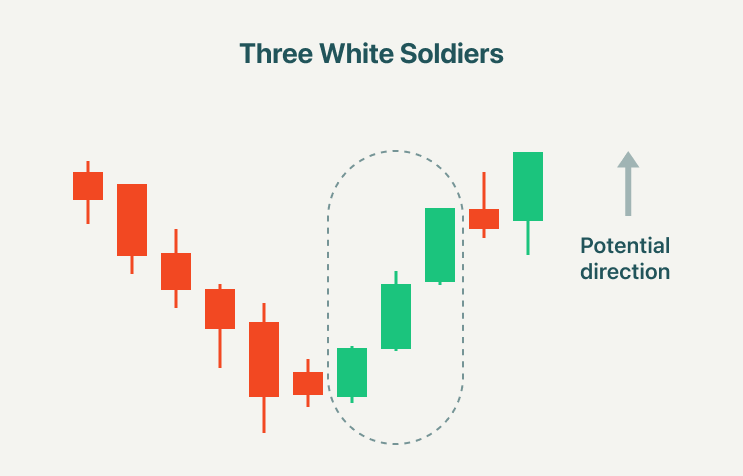
- What it means: Strong uptrend confirmation.
- Features: Three consecutive green candles with higher highs and higher closes.
6. Inverted Hammer

- What it means: Reversal signal during a downtrend.
- Features: Small real body, long upper wick, appears after a decline.
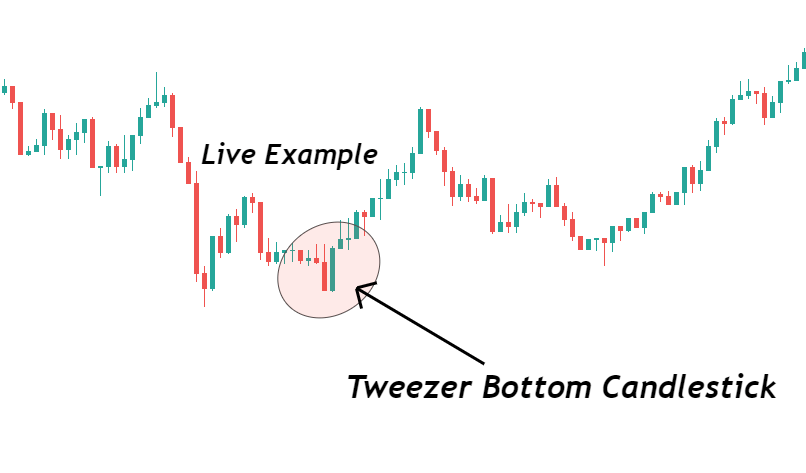
7. Tweezer Bottom
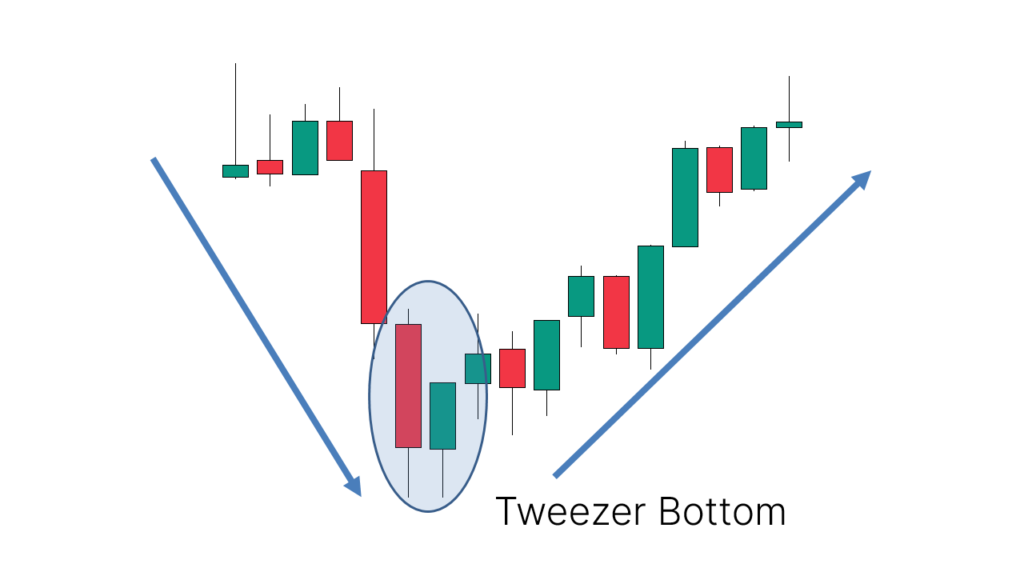
- What it means: Bullish reversal pattern.
- Features: Two or more candles with equal lows after a downtrend.
Common Bearish Candlestick Patterns
1. Shooting Star
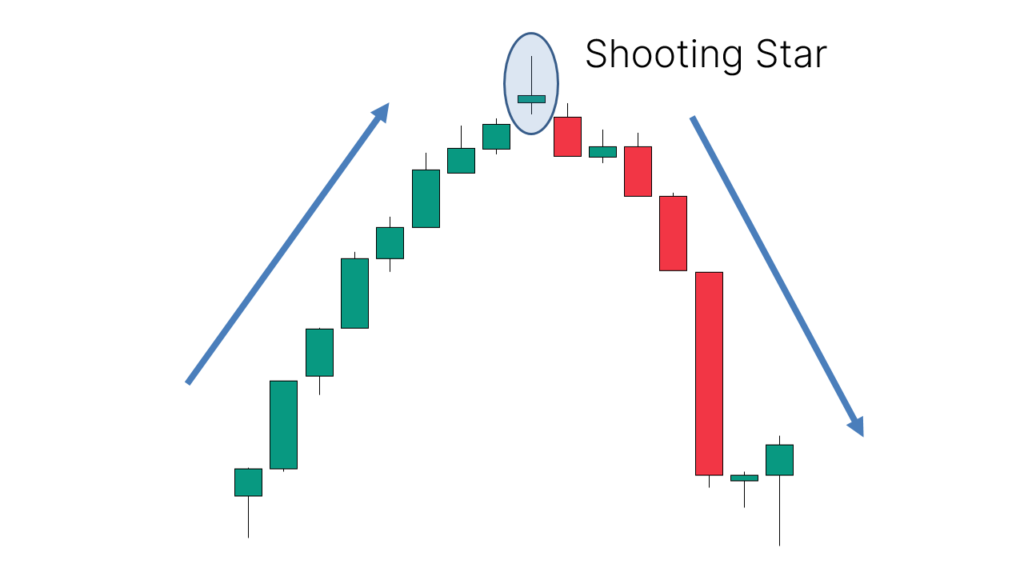
- What it means: Reversal from uptrend.
- Features: Small body, long upper wick, little to no lower wick.
- Tip: Look for confirmation with a red candle.
2. Bearish Engulfing
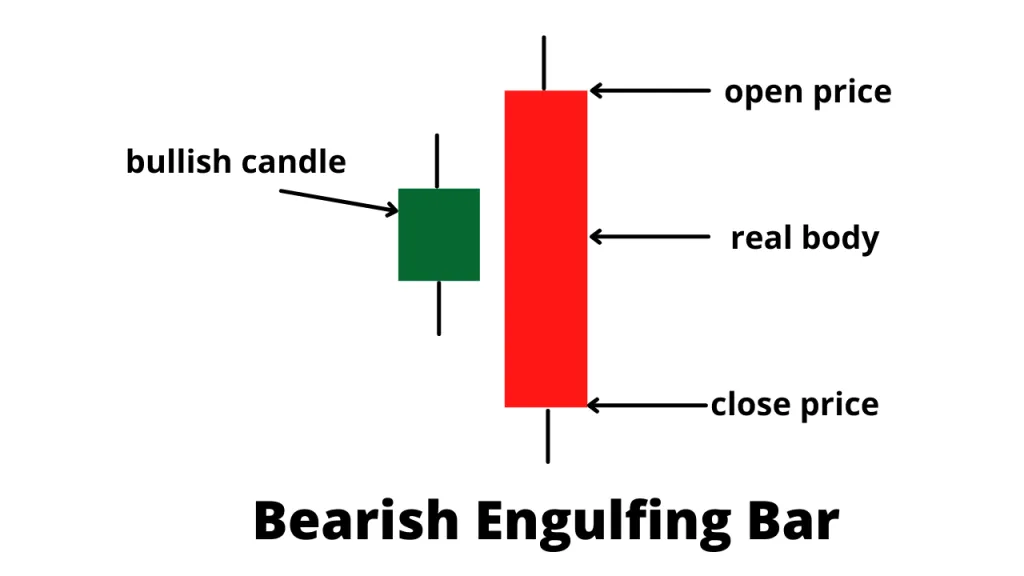
- What it means: Strong reversal to the downside.
- Features: Small green candle followed by a large red candle that fully engulfs it.
3. Evening Star
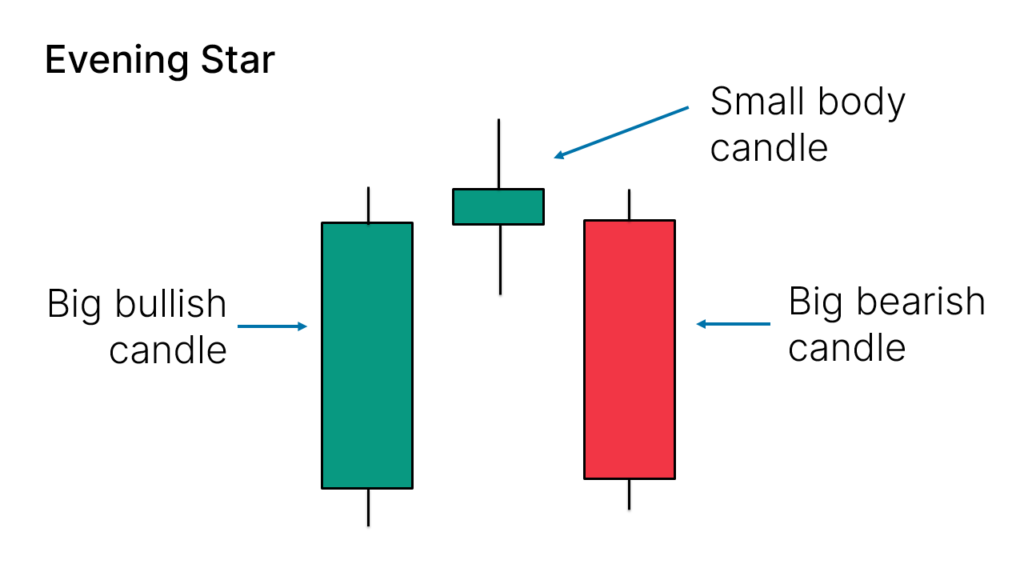
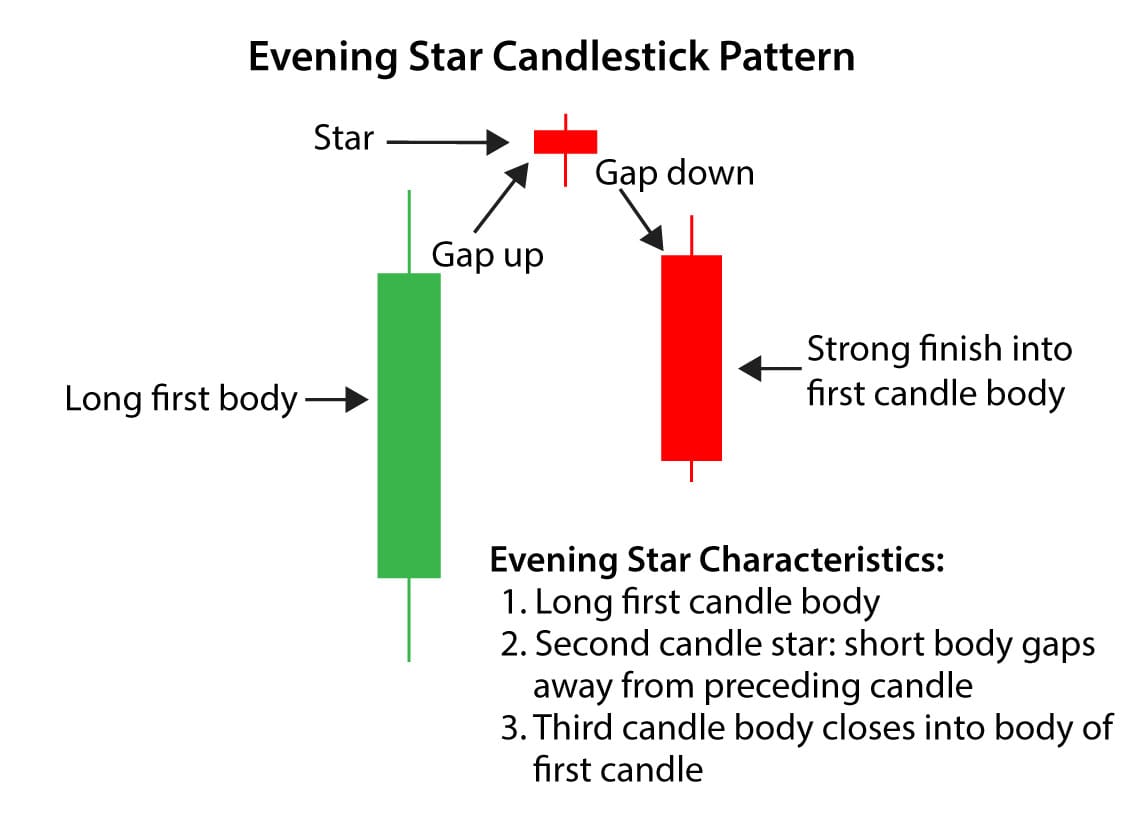
- What it means: Three-candle pattern signaling reversal.
- Features: One large green candle, one indecision candle, one large red candle.
4. Dark Cloud Cover
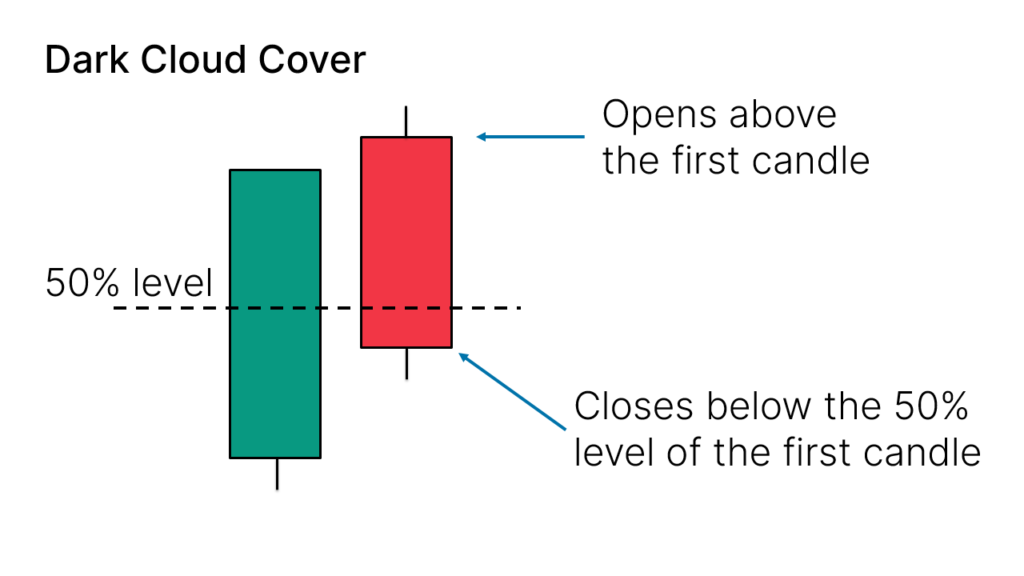
- What it means: A bearish trend could follow.
- Features: Green candle followed by red candle that opens higher but closes below the midpoint of the green candle.
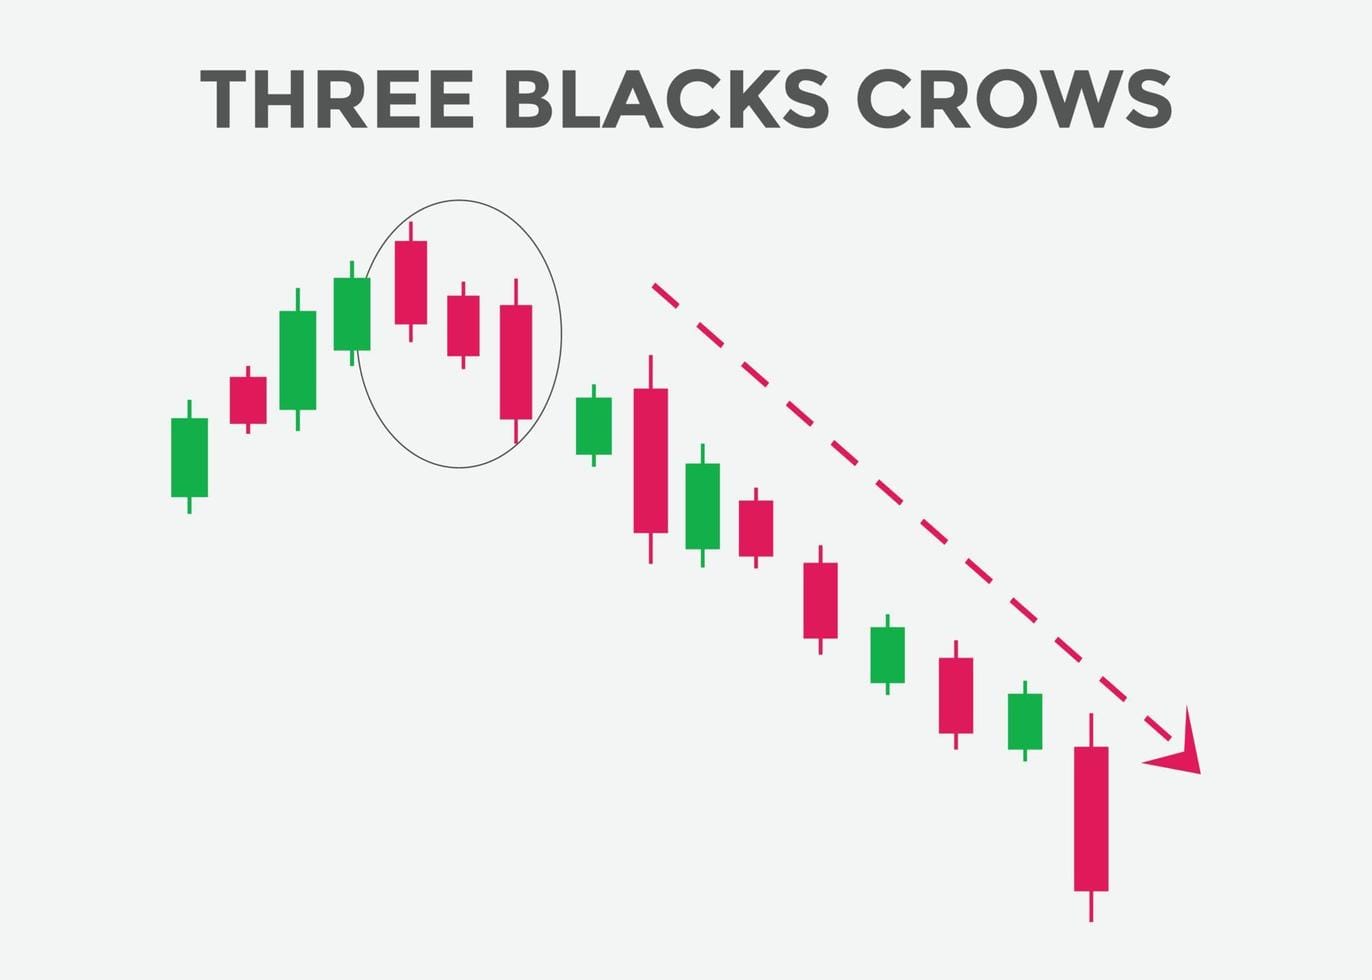
5. Three Black Crows
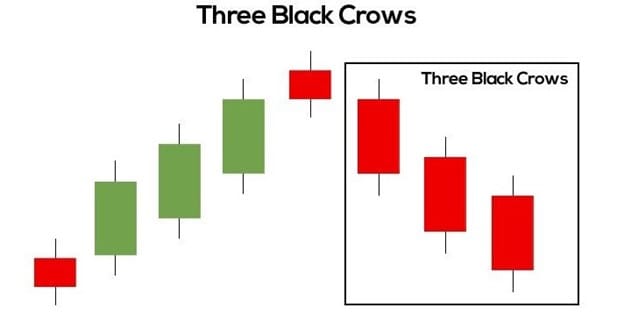
- What it means: Bearish continuation or reversal.
- Features: Three long red candles with lower closes.
6. Hanging Man
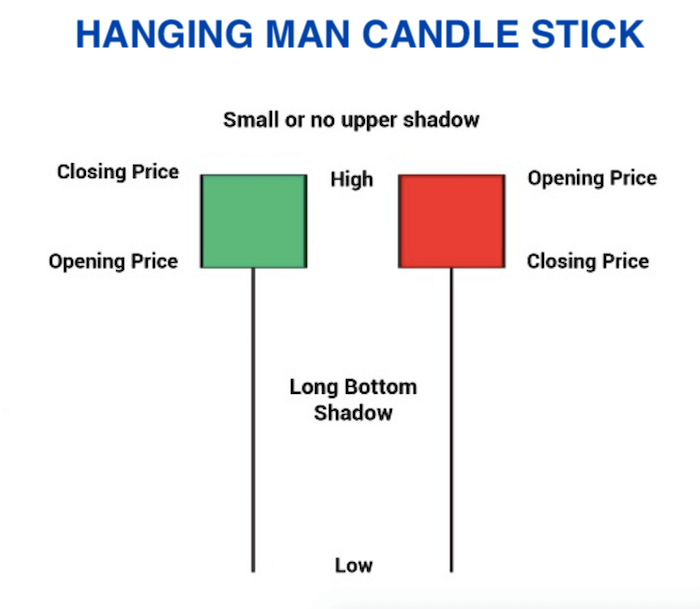
- What it means: Potential top and reversal signal.
- Features: Similar to a hammer but appears at the top of an uptrend.
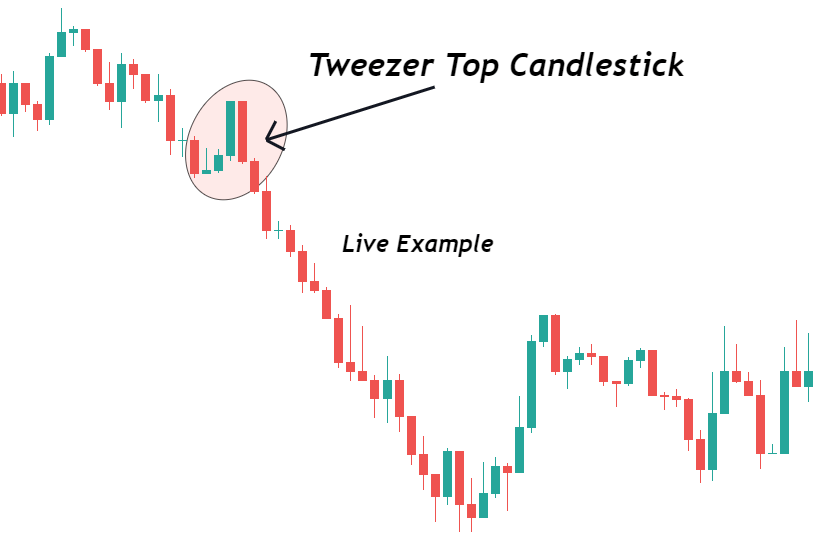
7. Tweezer Top
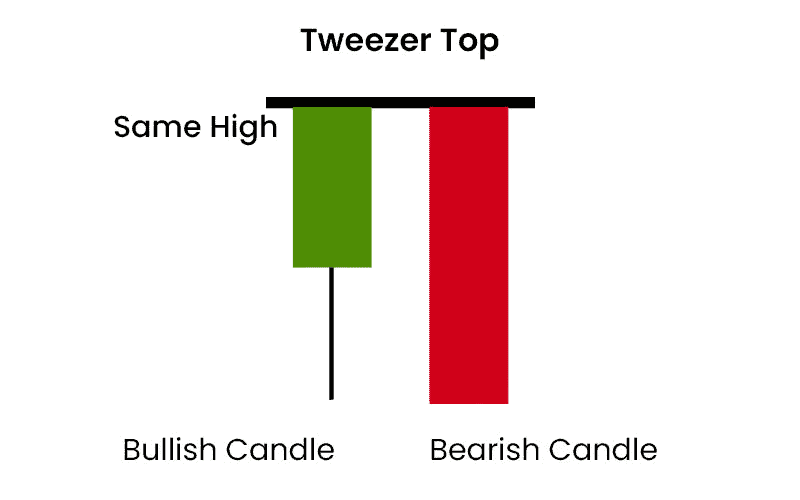
- What it means: Bearish reversal pattern.
- Features: Two or more candles with equal highs after an uptrend.
Real-World Trading Example
Imagine a stock in a downtrend forms a hammer candle on the 5-minute chart near support. The volume spikes and price reclaims VWAP and the 9 EMA. This confluence with the bullish hammer gives you confidence to enter a long position.
- Entry: Break above the hammer’s high
- Stop Loss: Just below the candle’s low
- Target: Next resistance zone or EMA
Combining candlestick patterns with indicators like RSI, EMAs, and VWAP increases the strength of your setup.
Tips for Using Candlestick Patterns
- Never use candlestick patterns in isolation — combine with support/resistance or indicators.
- Wait for confirmation — one candle doesn’t make a trend.
- Practice on historical charts to build confidence.
- Use higher volume as confirmation for reliability.
- Use journaling to track pattern success rates.
- Focus on high-probability zones: VWAP zones, key levels, and trend reversals.
Recommended Tools and Platforms
- Charting Software: TradingView
- Education Resource: Investopedia Candlestick Patterns
- Live Setups: TradeLifeMastery Live Alerts
- Community: Join Our Discord
Final Thoughts
Mastering candlestick patterns can transform the way you trade. They're not magic, but when used correctly, they give you a critical edge. Start incorporating them into your strategy, and journal your trades to see what works best in real time.
The more you study the language of candlesticks, the more fluent you’ll become in reading price action.


