How to Identify and Trade Breakouts for Maximum Profit
Unlock the power of breakout trading. This guide covers how to identify reliable breakout setups, implement proven strategies, manage risk effectively, and achieve consistent profits.


“Success is neither magical nor mysterious. Success is the natural consequence of consistently applying basic fundamentals.” — Jim Rohn
Breakout trading is one of the most powerful and effective methods traders use to capitalize on market momentum. It involves identifying key levels of support or resistance and entering trades as prices break decisively beyond these points. Done correctly, breakout trading can lead to substantial profits. In this detailed guide, you'll learn everything you need to successfully identify, confirm, and trade breakout setups.
Key Takeaways:
- Breakouts often follow tight consolidation or strong trend pauses.
- Confirm volume and structure before entering a breakout trade.
- False breakouts are common, wait for retest or candle close above/below the level.
- Use defined entries, stop-losses, and targets to control risk.
- News events can trigger clean or chaotic breakouts, be alert.
What Is Breakout Trading?
Breakout trading involves entering trades when the price moves strongly above resistance or below support levels. These breakout points typically signal the start of significant price moves due to market participants acting simultaneously in the new trend direction.
Why Breakout Trading Works
Breakouts represent a shift in market sentiment and momentum, leading to increased buying or selling pressure. Traders capitalize on these moves to capture large, quick profits.
Benefits of Breakout Trading:
- Clear Entry Signals: Breakouts offer definitive entry points.
- High Momentum Moves: Price movements following breakouts can be swift and substantial.
- Effective Risk Management: Clearly defined entry and stop-loss points enable better risk control.
How to Filter False Breakouts
False breakouts can trap traders on the wrong side of momentum. Here’s how to spot and avoid them:
- Wait for the candle close outside the breakout level, especially on the 1H or 4H timeframes.
- Use a retest strategy: let price return to the broken level and bounce before entering.
- Add a volatility filter like ATR – breakout should exceed average recent range.
- Check news calendar: Major economic releases can cause wick-based breakouts that reverse quickly. Avoid initiating trades minutes before or after the release.
How to Identify Reliable Breakouts
1. Support and Resistance Levels
Identify critical horizontal levels where price has previously stalled or reversed multiple times. These are high-probability breakout points.
2. Chart Patterns
Recognize reliable patterns like:

Each of these patterns signals potential breakouts clearly.
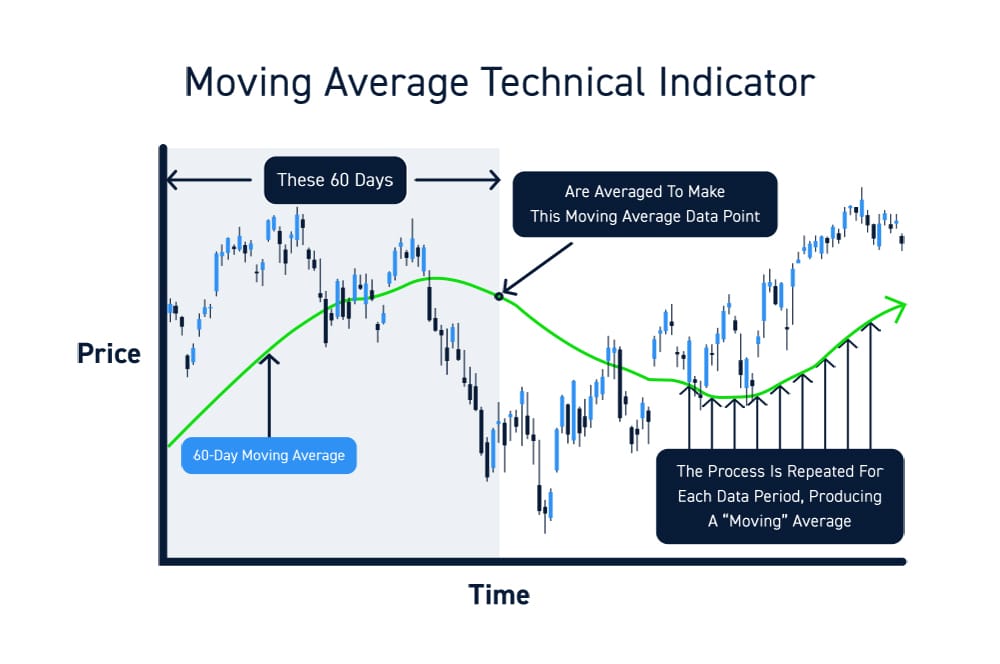
3. Moving Averages
Moving averages often act as dynamic support or resistance. Breakouts occur when prices decisively cross key moving averages like the 60-day or 200-day.
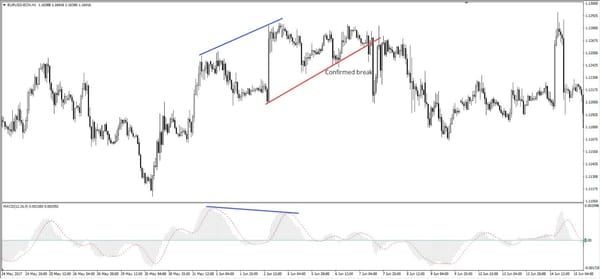
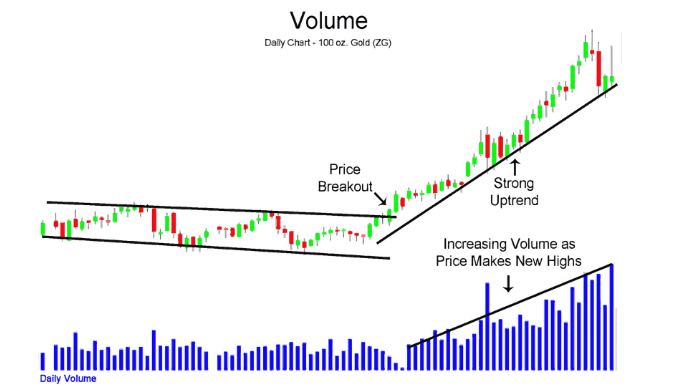
4. Volume Confirmation
Volume is critical in confirming genuine breakouts. A breakout accompanied by significantly higher volume indicates stronger conviction among market participants.
Proven Breakout Trading Strategies
Strategy 1: Simple Horizontal Breakouts
Entry Criteria:
- Identify a strong resistance (long trades) or support (short trades) level.
- Enter immediately or wait for a retest after a candle closes clearly beyond the level with high volume.
Risk Management:
- Stop-Loss: Just below the breakout level (longs) or just above (shorts).
- Profit Target: Previous highs or lows, measured moves, or using a trailing stop.
Strategy 2: Chart Pattern Breakouts
Entry Criteria:
- Confirm the formation of chart patterns like triangles or rectangles.
- Enter upon a decisive break and confirmation close beyond the pattern boundaries.
Risk Management:
- Stop-Loss: Set below or above the breakout candle or opposite pattern boundary.
- Profit Target: Measure the height of the pattern and project it from the breakout point.
Strategy 3: Moving Average Breakouts
Entry Criteria:
- Price clearly breaks through a critical moving average (e.g., 50 or 200 SMA/EMA).
- Confirmation with increased volume and strong candle patterns.
Risk Management:
- Stop-Loss: Set on the opposite side of the moving average or below recent swing points.
- Profit Target: Previous resistance/support or a fixed risk-reward ratio (minimum 1:2).
| Strategy Type | Entry Trigger | Stop Placement | Target Style |
|---|---|---|---|
| Retest Entry | After price breaks and returns | Below/above retested level | Previous swing / measured move |
| Candle Close Entry | After candle closes past level | Below breakout candle | Risk:Reward ratio (2:1 or 3:1) |
| News-Based Breakout | After high-impact news reaction | Below initial spike | Short-term scalp or continuation |
| Pattern Breakout | On breakout of triangle/wedge | Opposite side of pattern | Height of pattern projected out |
Advanced Breakout Techniques
Retest Breakout
After the initial breakout, wait for the price to retest the breakout point and enter on confirmation of the retest bounce.
False Breakouts (Failed Breakouts)
Learn to spot false breakouts by observing weak volume and candle wicks, enabling you to avoid common traps and losses.
Combining Breakouts with Indicators
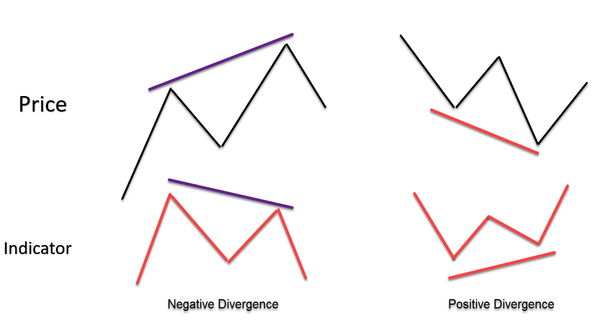
- RSI and Breakouts: Overbought/oversold conditions on RSI can validate or caution breakout trades.
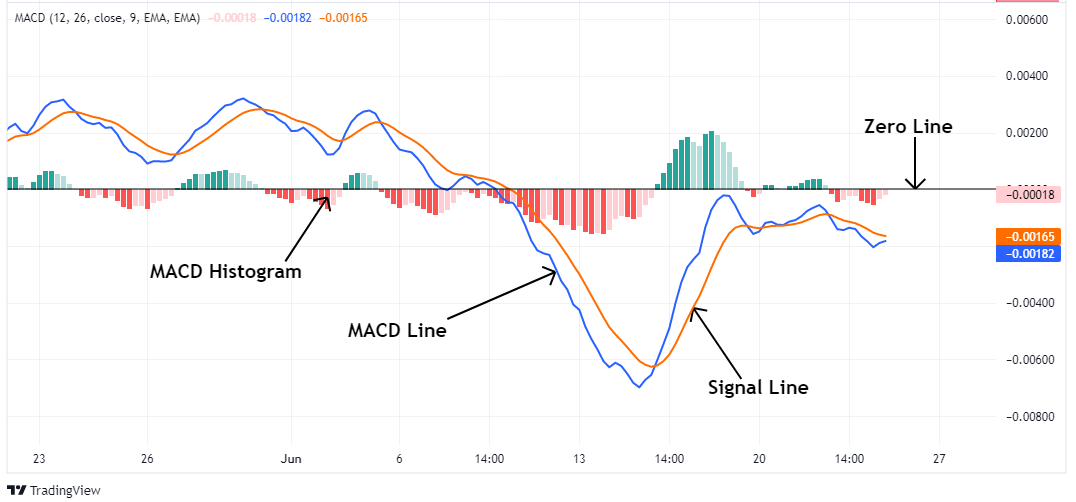
- MACD and Breakouts: MACD crossovers confirm momentum, strengthening breakout signals.
- Volume and VWAP: High volume and VWAP positioning confirm institutional participation, increasing breakout reliability.
Common Breakout Trading Mistakes
- Ignoring Volume: Always confirm breakouts with strong volume. Weak volume often signals false breakouts.
- Chasing Breakouts: Never chase a breakout after an extended move. Enter at or near the breakout point for the best risk-reward.
- Poor Risk Management: Maintain discipline with stops and targets to manage breakout risk effectively.
Real-Life Breakout Trading Example
Consider this scenario:
- Stock XYZ: Consolidating below a strong resistance level at $50.
- Breakout Entry: Price closes above $50 with heavy volume and strong bullish candle formation.
- Stop-Loss: Placed just below the $50 breakout level.
- Profit Target: Next clear resistance level around $55 for a favorable risk-reward ratio.
This scenario demonstrates clear entry, disciplined risk management, and strategic profit-taking.
Recommended Breakout Trading Tools
- TradingView: Charting software with pattern recognition and volume tools.
- Thinkorswim: Advanced breakout scanners and technical indicators.
- Broker Platforms: Built-in breakout alerts and analysis tools.
Internal Resources
External Resources
- Investopedia Breakout Guide:
https://www.investopedia.com/terms/b/breakout.asp
Final Thoughts
Breakout trading, when mastered, can provide excellent trading opportunities and consistent profitability. By clearly defining breakout criteria, implementing disciplined risk management, and continuously refining your strategies, you set yourself up for long-term trading success.
Incorporate the proven strategies shared in this guide, and remain patient and disciplined in your approach to breakout trading.
FAQs
Q1: How do I know if a breakout is real or fake?
Use candle close confirmation, volume, and possibly wait for a retest to confirm the move.
Q2: What timeframes are best for breakout trading?
4H and Daily for strong breakouts; 15M–1H for short-term trades with faster entries.
Q3: Can news events cause false breakouts?
Yes. News can cause large spikes that quickly reverse, so use caution and avoid trading immediately after major events.
Q4: Should I trade breakouts during Asian session?
Breakouts during Asia are often weak or fake unless driven by unexpected news. London and NY sessions are more reliable.
Q5: Do breakout trades work on all assets?
Breakouts apply to forex, stocks, crypto, and indices, but behavior may vary — always test on your preferred market.