How to Combine RSI with Market Structure for Better Reversals
RSI is a powerful momentum indicator, but it works even better with market structure. In this guide, learn how to combine RSI with support/resistance zones, trend pullbacks, and divergence patterns to catch cleaner and more confident reversals.

The RSI (Relative Strength Index) is one of the most popular tools for spotting overbought and oversold conditions. But when used alone, it can give misleading signals. This is especially in trending markets. That’s where market structure comes in. By combining RSI with key structural elements like support, resistance, swing highs and lows, or trendlines, you can dramatically improve your ability to spot real reversals and filter out false ones.
In this article, you’ll learn how to pair RSI with price structure to make more confident trading decisions.
Key Takeaways
- RSI is more reliable when combined with support, resistance, and price patterns.
- Market structure gives context to RSI readings, preventing early or false entries.
- The best reversal signals happen when RSI divergence aligns with structure.
- You can use this combo in all markets: forex, crypto, stocks, or indices.
What Is Market Structure?
Market structure refers to the way price moves: highs, lows, trends, ranges, and the key zones traders watch. It’s the roadmap of price.
The basics include:
- Higher highs and higher lows = uptrend
- Lower highs and lower lows = downtrend
- Equal highs or lows = potential double tops/bottoms or range
- Support and resistance levels = previous swing highs or lows where price reacted
Understanding structure helps you know where price is likely to reverse, stall, or break out.
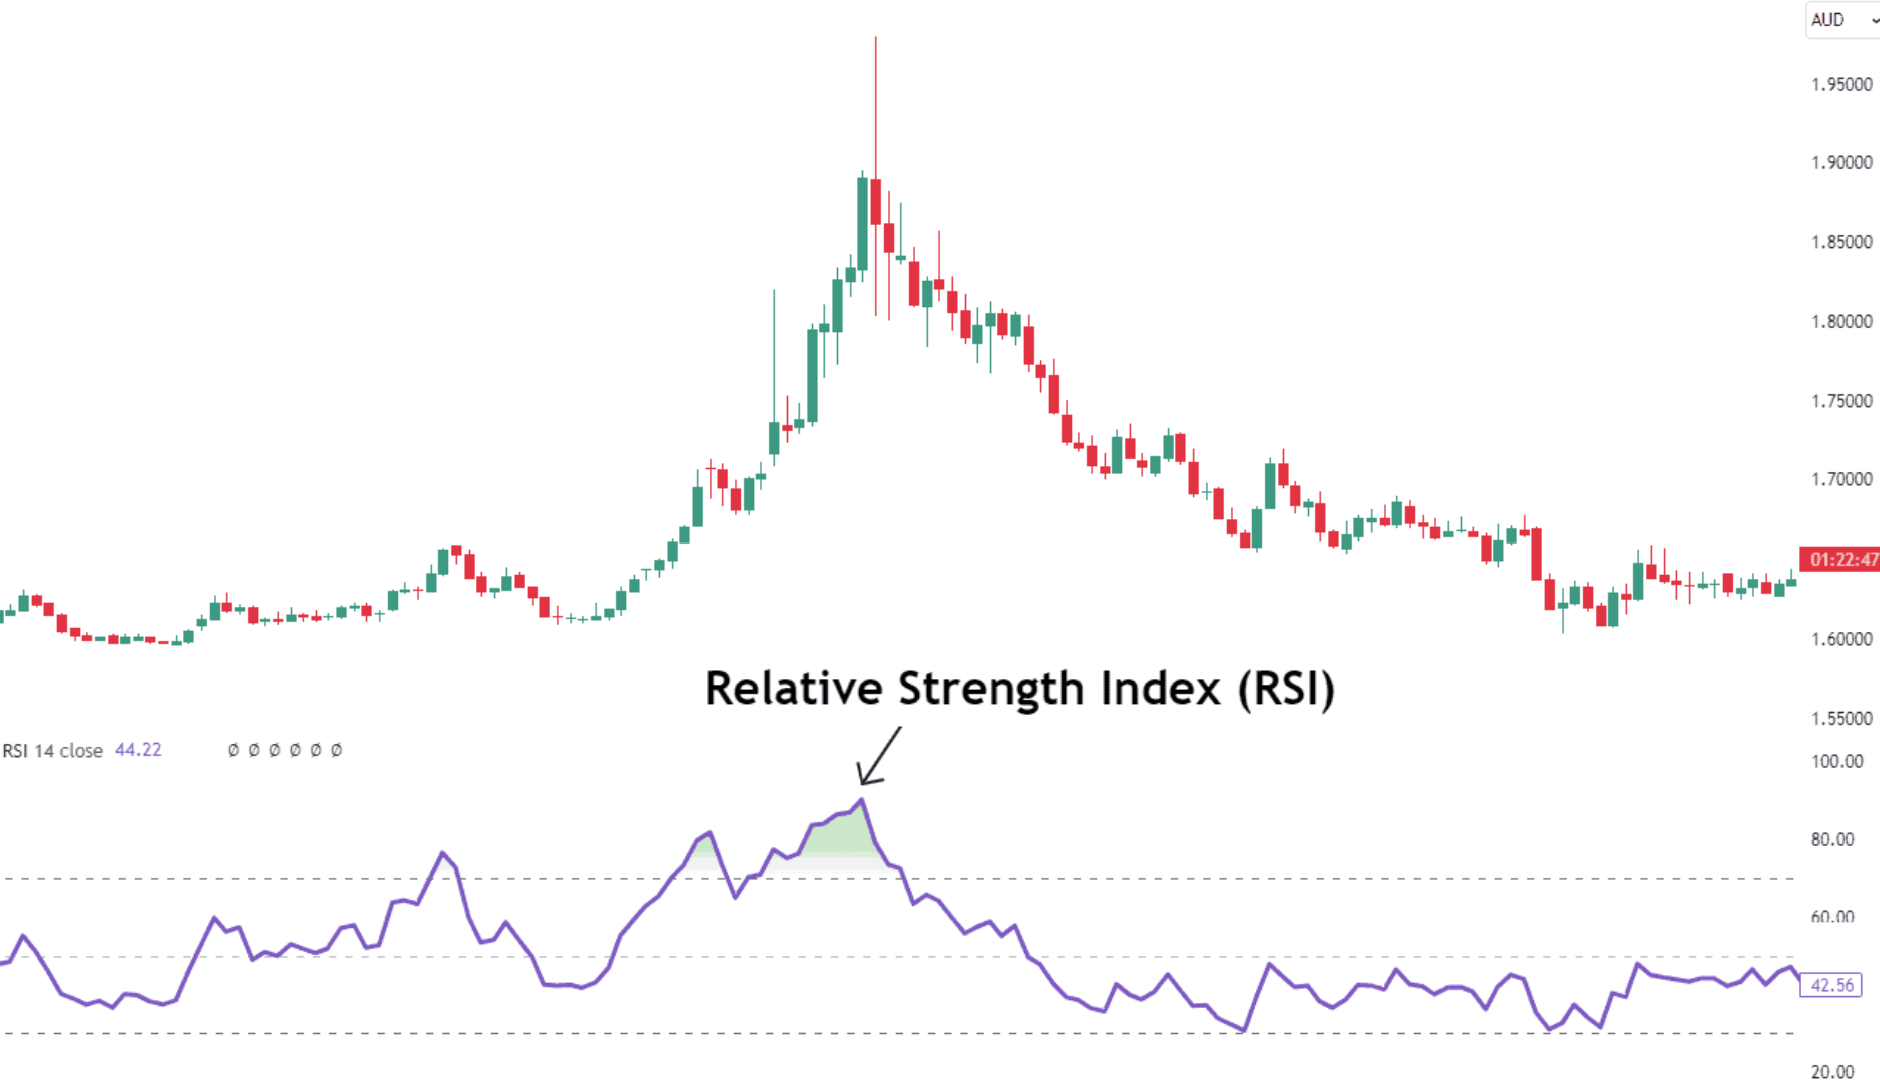
Why RSI Alone Isn’t Enough
RSI measures momentum, but it doesn’t tell you anything about price levels or zones where reversals are likely. RSI can show overbought conditions (above 70), but price may continue to rise. Likewise, RSI may be oversold (below 30), but price might still drop.
The solution? Use RSI at key structural points to confirm what the chart is already telling you.
How to Use RSI + Market Structure for Reversals
Using RSI with market structure creates a powerful combination that helps filter out false signals and catch clean reversal setups. Here's how to use them together step-by-step:
RSI at Key Support and Resistance Levels
RSI signals become more meaningful when price is reacting at predefined levels of interest, areas where price has reversed before or consolidated in the past. This could be a horizontal support or resistance level, a trendline, or a demand/supply zone.
How to apply:
- Identify major support and resistance levels using recent swing highs/lows.
- Watch for RSI to reach an extreme, below 30 for oversold (potential buy), above 70 for overbought (potential sell).
- Combine this with price rejection (like a pin bar or engulfing candle) at the level.
Why it works:
You’re only taking RSI signals in high-probability zones, where reversals already make sense. RSI confirms that momentum is stretched right where price is likely to turn.
Example Setup:
Price approaches a multi-week resistance level. RSI hits 73. A bearish engulfing candle forms. That’s a confluence of structure and momentum which is an ideal reversal signal.
RSI Divergence + Structural Confirmation
Divergence is one of the strongest reversal signals, but it becomes twice as effective when it occurs at meaningful structural points.
Types of divergence:
- Bearish divergence: Price makes a higher high; RSI makes a lower high. Signals weakening momentum despite price rising.
- Bullish divergence: Price makes a lower low; RSI makes a higher low. Signals buyers stepping in even as price drops.
What makes it stronger:
If divergence happens at a trendline, horizontal zone, or Fibonacci level, it’s more likely to mark a real reversal rather than a temporary bounce.
Pro Tip:
Combine divergence with a break of structure (e.g., price failing to make a new high/low afterward) to confirm the reversal is underway.
RSI Pullbacks Aligned with Trend Structure
In trending markets, you don’t always want to catch reversals, you may want to trade pullbacks instead. RSI helps here too when combined with structure.
How to do it:
- In an uptrend, look for price to form a higher low, and RSI pulls back to the 40–50 zone.
- In a downtrend, wait for a lower high in price, and RSI retraces to the 50–60 zone.
These RSI zones often act like momentum support/resistance. If price respects structure and RSI starts turning back in the direction of the trend, it’s often a good continuation entry.
Why it works:
You’re buying dips and selling rallies with the trend, using RSI to time them more precisely.
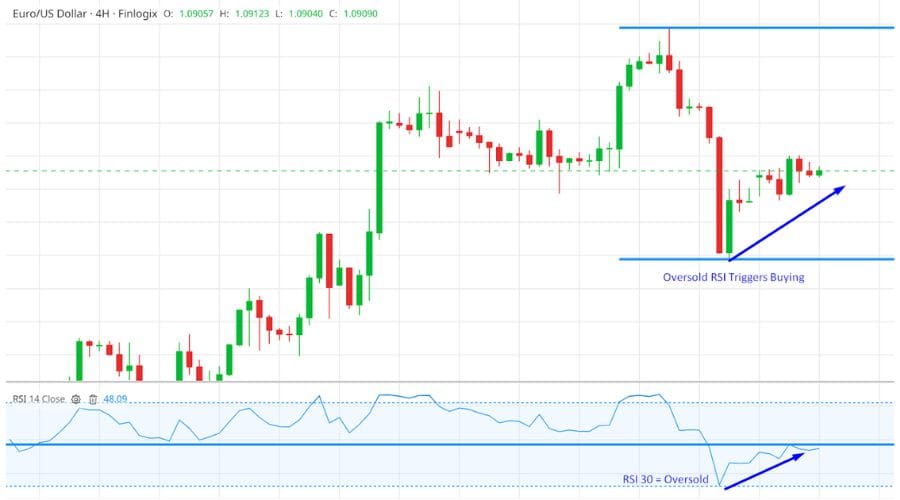
Reversals at Range Boundaries
Markets often go sideways trading in tight ranges before breaking out. In these conditions, RSI 70/30 levels become very reliable when combined with the edges of the range.
How to do it:
- Mark the top and bottom of the range with horizontal lines.
- Wait for RSI to hit 70 near the top of the range or 30 near the bottom.
- Look for signs of rejection such as wick rejections, double tops/bottoms, or inside bar patterns.
Add extra confirmation:
If RSI forms divergence at the range boundary (e.g., price makes a new high but RSI doesn't), the chance of a reversal becomes even higher.
Structure Breakouts with RSI Shift
Sometimes, reversals are clearer after a break of structure. This happens when price breaks a trendline or forms a lower low (in an uptrend) or higher high (in a downtrend).
Use RSI to confirm:
If the structure break occurs and RSI crosses the 50 line in the same direction (e.g., RSI goes below 50 after a support break), it adds momentum confirmation to the new move.
This is helpful for traders who want to wait for confirmation rather than catch tops or bottoms early.
Example Trade Setup (Bullish Reversal)
- Price drops into a strong support zone marked from previous lows.
- RSI dips below 30 and then turns upward.
- A bullish candle forms (e.g., engulfing or pin bar).
- Entry: Buy after confirmation candle closes.
- Stop-loss: Just below the support level.
- Target: Previous swing high or next resistance.
This is a classic RSI + structure reversal with confirmation.
Conclusion
RSI is a great tool for identifying momentum, but without market structure, it often gives false alarms. By combining RSI with key support/resistance zones, price patterns, and trends, you turn it into a high-probability reversal indicator.
Next time RSI hits an extreme, pause and check the chart. Ask: Is this happening at an important level? Is there divergence? Is structure confirming? If yes, you’ve got something worth watching.
Frequently Asked Questions (FAQs)
1. What timeframe works best for RSI + structure setups?
1-hour and 4-hour charts are popular. Higher timeframes give stronger signals.
2. Can I use RSI and structure for scalping?
Yes, but use a faster RSI setting (like 7) and tighter structure levels.
3. What if RSI is extreme but not at structure?
It might be a false signal. Wait for price to reach a key zone first.
4. Is RSI divergence alone enough to trade?
It’s better with structure confirmation. Divergence without a zone can fail.
5. What other tools can I combine with RSI and structure?
Volume, Fibonacci, moving averages, and candlestick patterns work well as confirmation.