How to Avoid Choppy Markets Using ATR Readings
Choppy markets can be a trader’s worst enemy as it’s full of fakeouts, stress, and losses. But with the ATR indicator, you can spot low-volatility zones early and avoid getting stuck. This guide shows how to use ATR to filter trades, time entries, and stay out of chop.


"Success in trading comes from clarity, not chaos." – Linda Bradford Raschke
Choppy markets are tough. They move up and down fast but go nowhere. Many traders lose money in these sideways zones, especially when they don’t notice the warning signs. This is where ATR, or Average True Range, comes in. ATR doesn't tell you where price will go, but it tells you how much it’s moving. And that’s a big clue if a market is stable or just noisy. In this article, we’ll show you how to spot chop using ATR and stay out of trouble.
Key Takeaways
- ATR shows how much price moves, not where.
- Choppy markets often have low and flat ATR values.
- Avoiding chop can save your account from small, repeated losses.
- Pair ATR with support/resistance to confirm better zones to trade.
- Knowing when not to trade is a winning skill.
What Is a Choppy Market?
A choppy market is when price moves up and down but has no real direction. This is also called range-bound or sideways movement. In these conditions, trades often fail because there’s no strong trend. You may enter a trade thinking it will move big, only to get stopped out when price snaps back. Choppy zones eat up both confidence and capital.
How ATR Helps Spot Choppy Conditions
When the market lacks direction and moves up and down without clear trends, traders call it “choppy.” These environments are tough because signals become confusing, and stop-losses get hit more often. ATR (Average True Range) can help you stay out of these tricky areas by showing when volatility is too low or inconsistent.
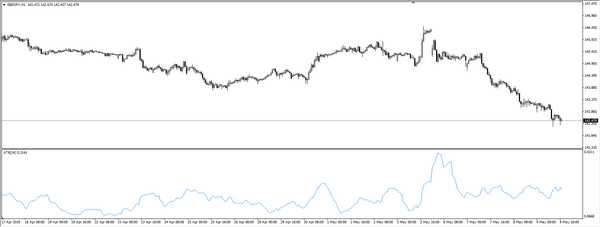
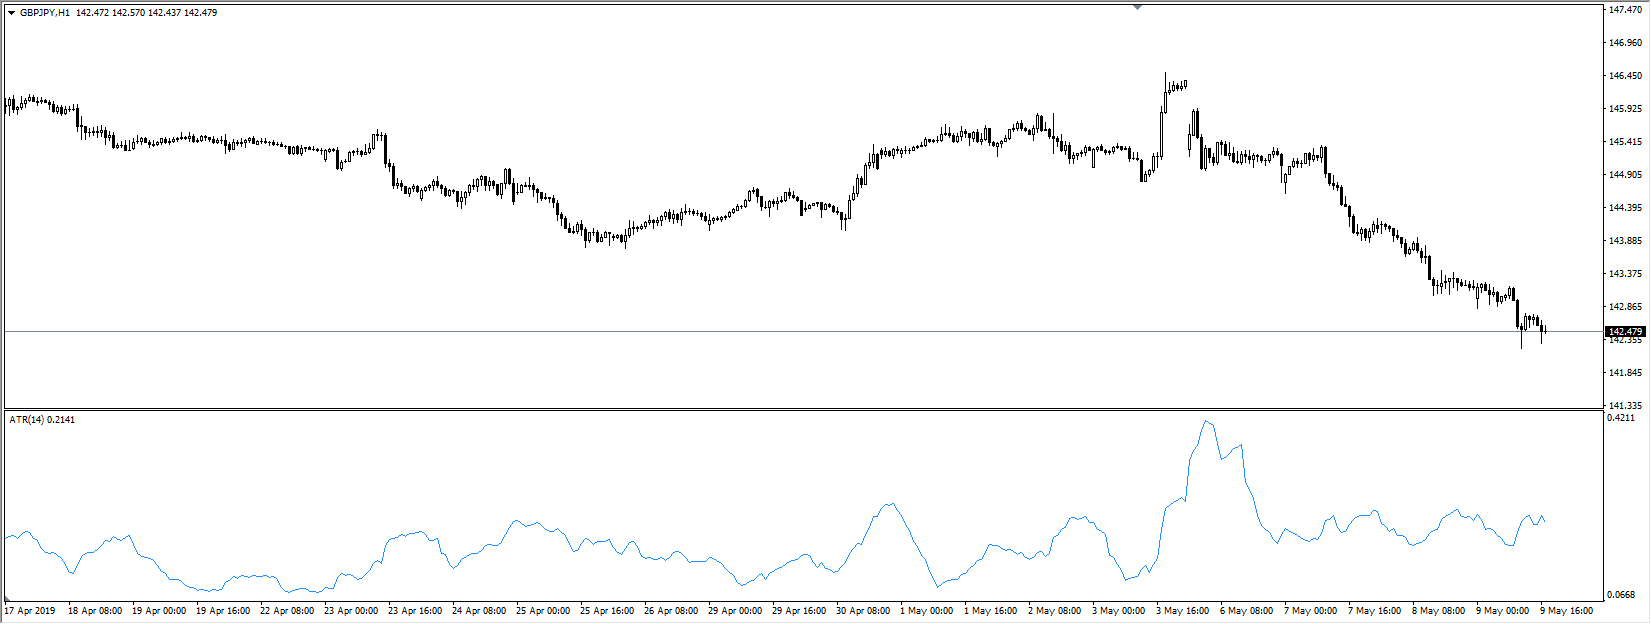
Low ATR = Tight Ranges
One of the clearest signs of a choppy market is a low ATR reading. When the ATR is shrinking over time, it means the price isn’t moving much from candle to candle. This often happens when the market is stuck in a range, bouncing between support and resistance without breaking out.
If ATR is very low, it’s a warning sign that the market lacks momentum. During these times, it’s hard to get good follow-through on trades. Prices may react to every small news item or random spike. This can trap traders on both sides of the market.
Flat or Sideways ATR
Sometimes, ATR doesn’t fall sharply, but instead flattens out. A flat ATR often signals the start of a range-bound phase or a market waiting for news. This sideways action in the ATR line suggests that the market is neither gaining nor losing strength. If you see this on the chart, be cautious. It’s a clue that price may chop sideways before the next move.
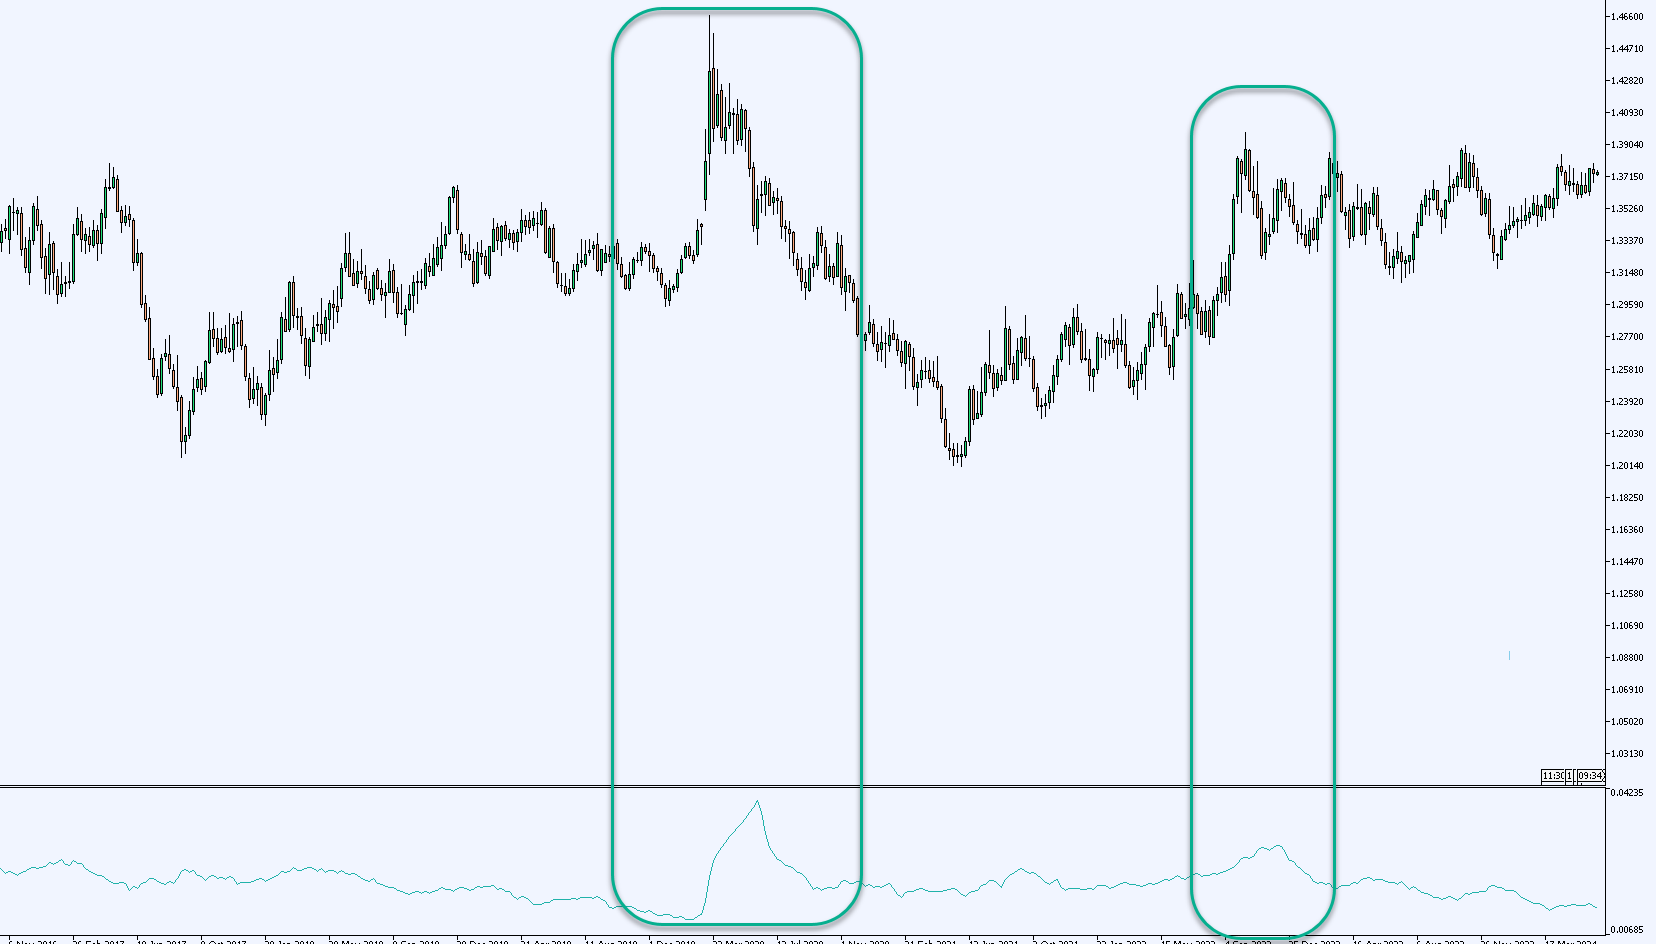
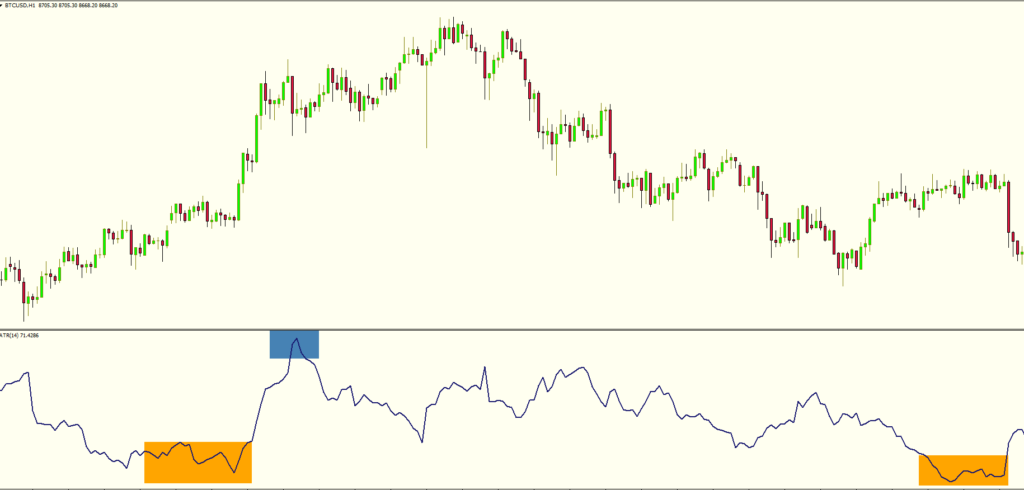
Sudden Spikes After Flat Periods
Occasionally, ATR stays low for a while and then suddenly spikes. This can mean one of two things: a breakout is coming, or a fakeout might trap traders before reversing. Watching how ATR behaves before and after such spikes can help you prepare. If ATR increases while the price starts to trend, it may be the start of a real move. But if ATR spikes and price immediately snaps back, it may just be a trap.
Using ATR to Filter Trade Setups
You can use ATR as a filter before entering trades. If ATR is very low or dropping, it might be better to skip that trade, even if your strategy gives a signal. This helps reduce the number of false entries caused by unpredictable, back-and-forth price action.
Traders can also set a personal threshold, like avoiding trades when ATR is below a certain level compared to recent history. For example, if the ATR is at its 20-day low, that might be your signal to hold off.
Using ATR to Stay Out of Bad Trades
One of the best uses of ATR is simply learning when not to trade. Many traders enter the market just because they see price move. But if ATR is low and price is bouncing inside a tight range, it’s better to wait. Look at past periods when ATR was low. You’ll often see choppy, whipsaw moves. If you spot this setup again, stay on the sidelines.
High vs Low ATR Environments
|
Factor |
High ATR |
Low ATR |
|
Price Movement |
Wide swings, big candles |
Small candles, tight range |
|
Trading Opportunities |
Trending setups possible |
Choppy, fakeouts common |
|
Suitable Strategies |
Trend-following, momentum |
Range or no-trade zones |
|
Stop-Loss Needs |
Wider stops needed |
Tight stops (more risk of hit) |
|
Entry Timing |
Pullbacks, breakouts |
Wait or use boundaries |
Smart Tips to Avoid Chop with ATR
Choppy markets can eat up your trading account if you’re not careful. ATR can be your early warning system, helping you avoid sideways, no-direction zones where false signals are common. Here’s how to use it wisely:
Watch for Falling ATR Before Entering Trades
One of the easiest ways to avoid chop is to check if ATR is dropping steadily before a setup. A falling ATR usually means shrinking price movement and this often happens during range-bound conditions. If ATR is lower than it’s been over the past few sessions, skip the trade or reduce your position size.
For example, if ATR has been falling for 5–6 candles in a row, you might be entering just as the market is about to stall. Wait until volatility picks up again before re-entering.
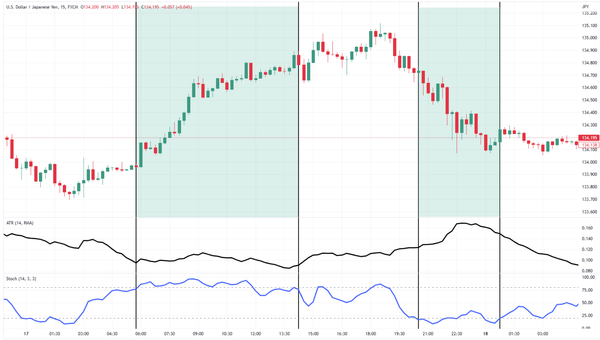
Combine ATR with Price Action
Don’t just rely on ATR alone. Combine it with visual price structure. If ATR is low and price is stuck between support and resistance levels with no clear break, that’s a red flag. But if ATR is rising and price breaks out cleanly, there’s a higher chance of follow-through.
Also look for wicks and false breakouts during low ATR phases as these are classic signs of chop. Avoid trading into those zones unless the market confirms a new direction with a clear range expansion and higher ATR.
Set ATR-Based Filters for Your Strategy
Many traders add a minimum ATR condition to their trading rules. For instance, only trade if ATR is above a certain value that reflects meaningful movement on your chosen timeframe. If ATR is below your custom threshold, stay on the sidelines.
This helps prevent overtrading during low-volatility periods when setups might look good on the surface but fail due to lack of momentum.
Use ATR to Time Breakout Confirmation
Breakouts that follow low ATR periods can be tricky. Many turn into fakeouts. To avoid this, don’t enter immediately on a breakout candle. Wait to see if ATR starts climbing after the move. If it does, that’s a sign the market is expanding and may have the energy to continue.
This wait-for-confirmation approach helps reduce premature entries and improves your chances of catching a real trend, not just a quick pop-and-drop.
Adjust Stop-Loss Strategy for Choppy Zones
When ATR is low and markets are moving sideways, tight stop-losses are more likely to get hit. If you must trade in these zones, consider placing stops a little wider or better yet, wait for clearer signals in trending conditions.
Alternatively, use ATR to calculate a custom stop-loss size. For example, if the current ATR is 10 pips, place your stop 1.5x or 2x ATR away from your entry. This adapts your risk management to the current market environment.
Conclusion
ATR may not get as much attention as other flashy indicators, but it's a great tool to stay out of bad trades. Especially in choppy markets, it acts like a warning light. If the market is quiet and ATR is low, think twice before jumping in. Waiting for clear, high-ATR moves often gives you better odds. In trading, staying safe is just as important as making gains.
FAQs
1. What is considered a low ATR value?
It depends on the pair and timeframe. But if ATR is at multi-day or multi-week lows, it's usually a sign of chop.
2. Can ATR predict market direction?
No. ATR only measures how much price moves, not where it will go next.
3. How do I set up ATR on my chart?
Most platforms have ATR by default. Use the standard 14-period setting to start.
4. Should I avoid all low ATR periods?
Not always. If you're a range trader, low ATR might be your friend. But trend traders should be careful.
5. Can I combine ATR with other indicators?
Yes! It's great with RSI, moving averages, or structure tools like support/resistance.