Hidden Divergence: The Overlooked Signal for Smart Traders
Hidden divergence is a powerful but often missed tool in the technical trader’s toolkit. When understood and applied correctly, it provides a high-probability signal that can help you identify trend continuation setups with precision.

"The market is a device for transferring money from the impatient to the patient." – Warren Buffett
When most traders learn about divergence, they stop at regular divergence—used to catch reversals. But few go deeper and study hidden divergence, a subtle yet high-probability pattern that suggests trend continuation. If you're a momentum or trend trader, this could be your secret weapon.
What Is Hidden Divergence?
Hidden divergence occurs when price makes a higher low (in an uptrend) or a lower high (in a downtrend), while your indicator (like RSI or MACD) shows the opposite. This indicates that momentum remains strong in the current trend direction, even though the pullback might make it seem otherwise.
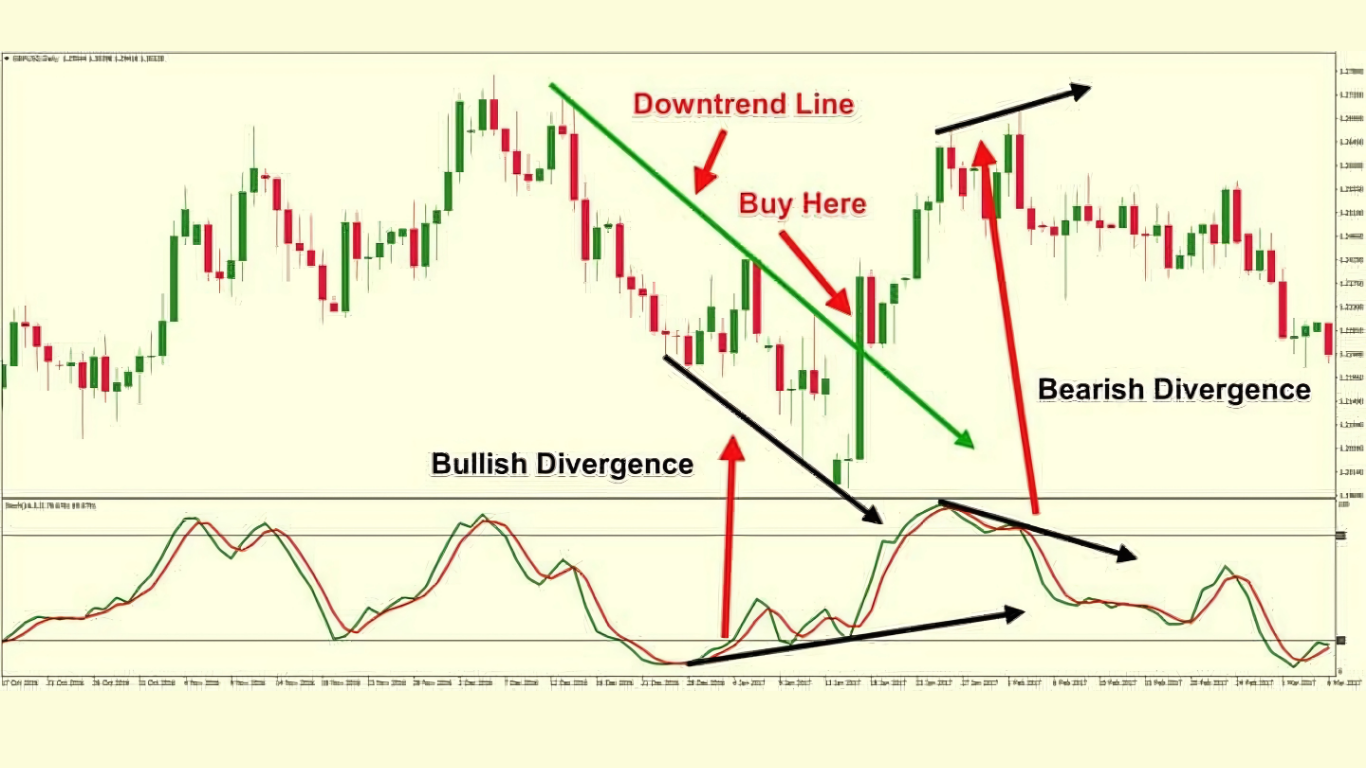
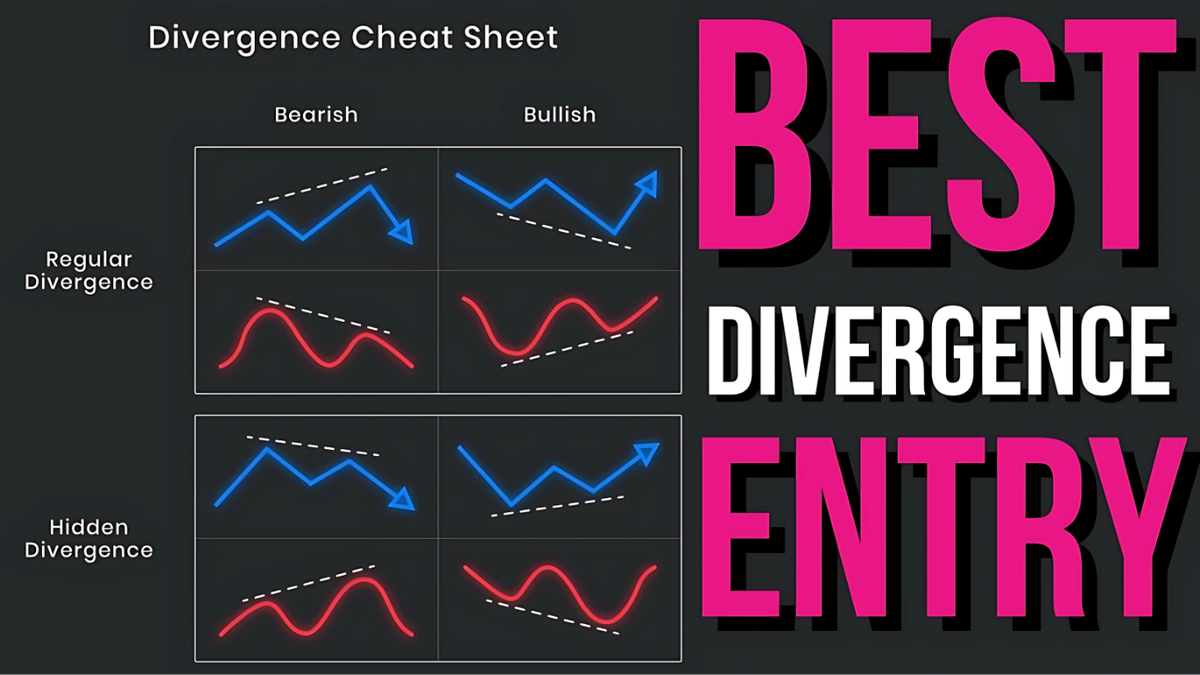
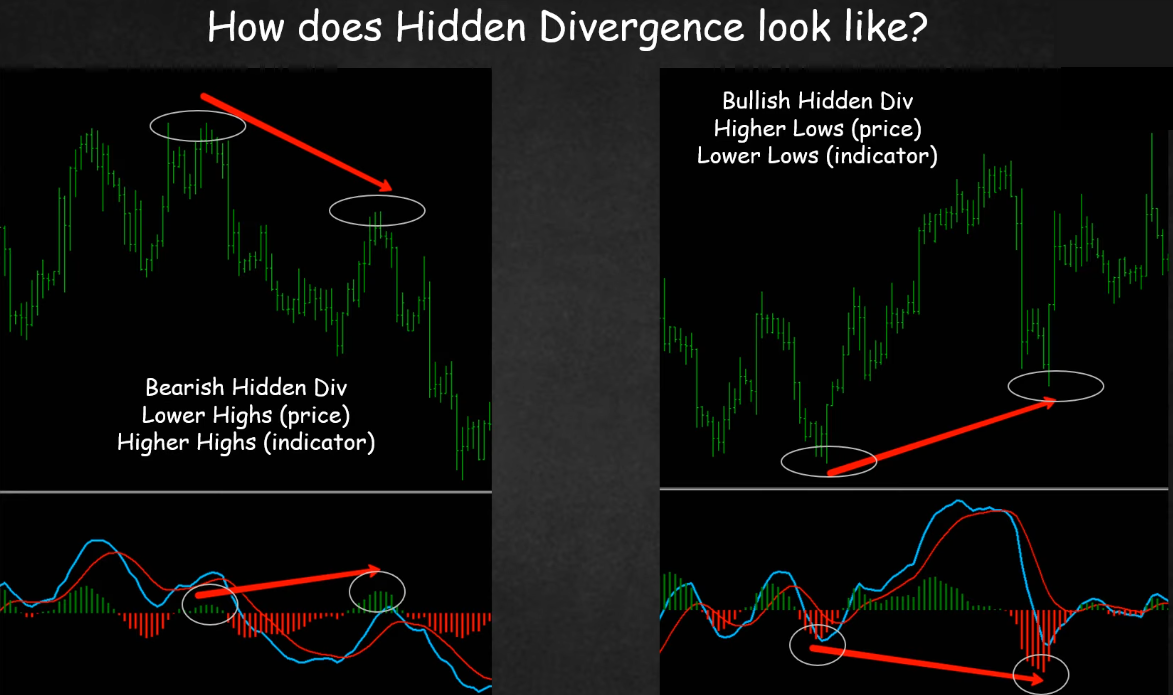
👉 Bullish Hidden Divergence:
- Price makes a higher low
- Indicator makes a lower low
👉 Bearish Hidden Divergence:
- Price makes a lower high
- Indicator makes a higher high
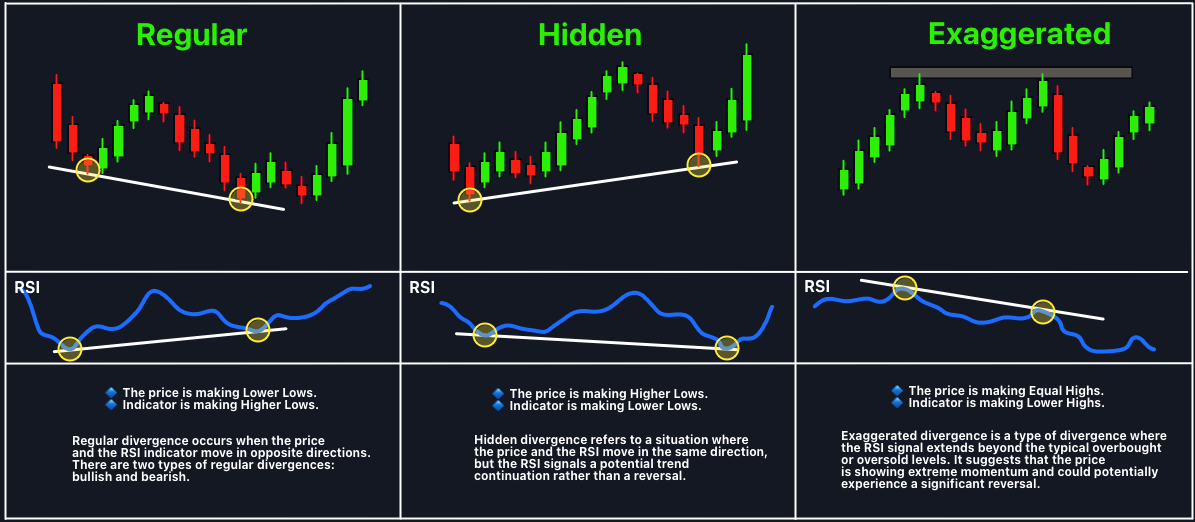
Hidden divergence signals trend continuation, unlike regular divergence, which signals potential reversal.
Why Hidden Divergence Works
Momentum indicators like the RSI and MACD don’t lie about underlying market strength. When price pulls back but indicators move to an extreme, it reveals that the market still favors the trend.
This can give you an edge in:
- Confirming trend direction
- Identifying pullback entries
- Avoiding fakeouts and premature reversals
Best Indicators to Use
- RSI (Relative Strength Index): Easy to spot divergence using 14-period RSI
- MACD (Moving Average Convergence Divergence): Great for confirming divergence across multiple timeframes
- Stochastic Oscillator: Good for timing entries after divergence signals
How to Trade Hidden Divergence
1. Identify the Trend
Use a moving average or simply identify higher highs and higher lows (or vice versa). You’re looking for established momentum.
2. Spot Divergence
Compare the indicator’s swing high/lows with the price’s swing high/lows. Look for mismatch patterns (as described above).
3. Wait for Confirmation
Wait for price to break back in the direction of the trend. A break of a trendline, support/resistance, or bullish/bearish engulfing pattern is helpful.
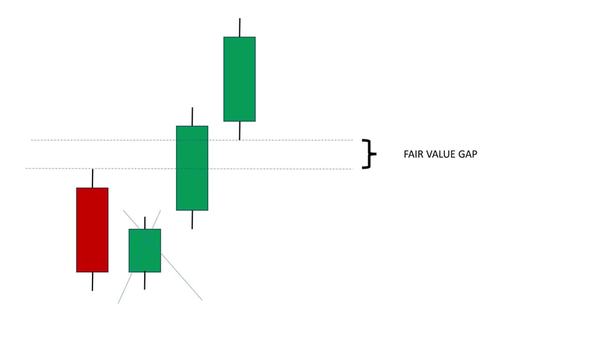
🔗 How to Read Candlestick Patterns Like a Pro
4. Manage Your Risk
Always use stop-loss orders below the divergence pivot low/high.
🔗 Stop Losses – How to Use Stop Loss Orders Like a Pro
Real-World Example: Hidden Bullish Divergence on SPY
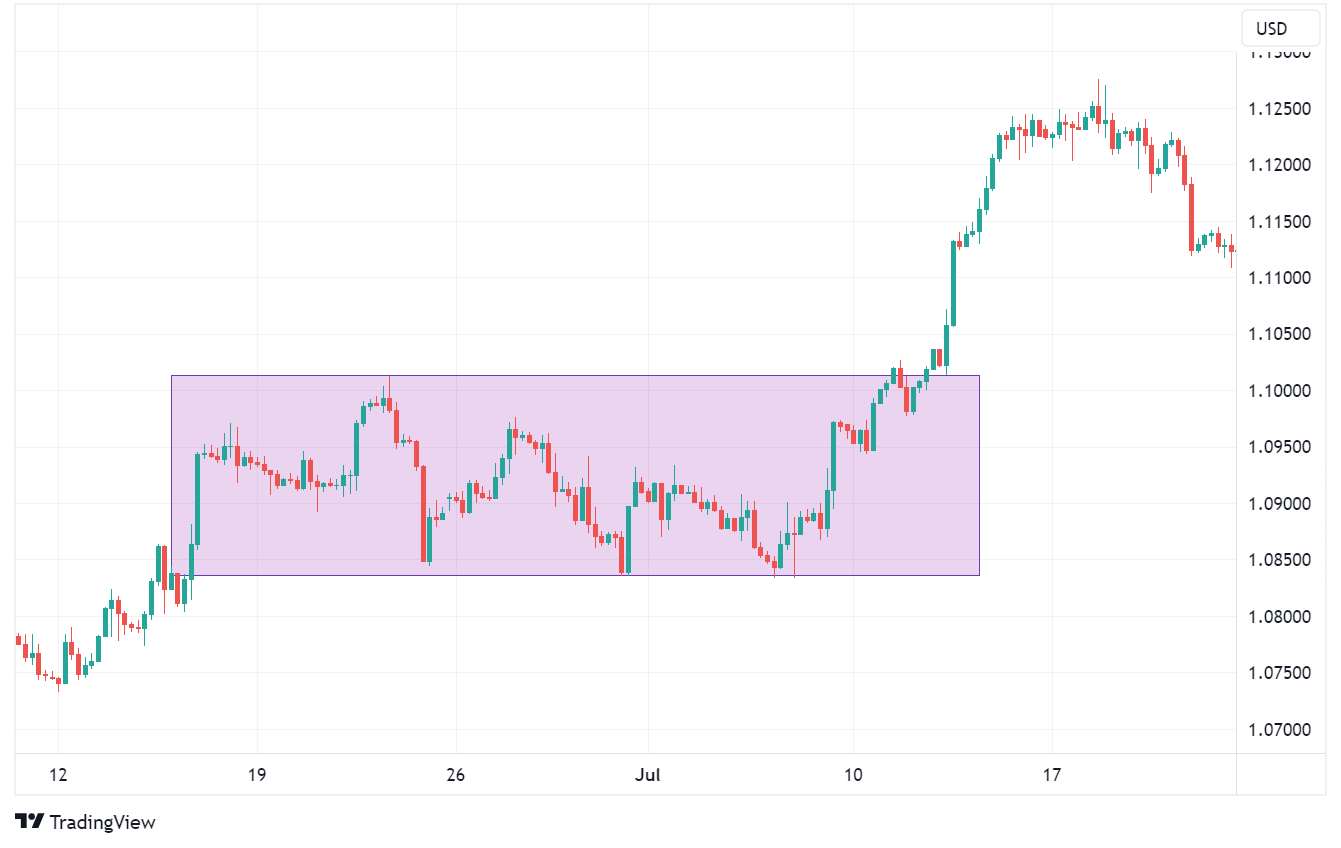
Let’s say SPY pulls back to a support zone and forms a higher low. But the RSI dips below 30 and forms a lower low. That’s hidden bullish divergence.
You could enter on a breakout of the pullback with a stop below the higher low and a target near recent highs.
Combining Hidden Divergence With Other Tools
Hidden divergence becomes even more powerful when you combine it with:
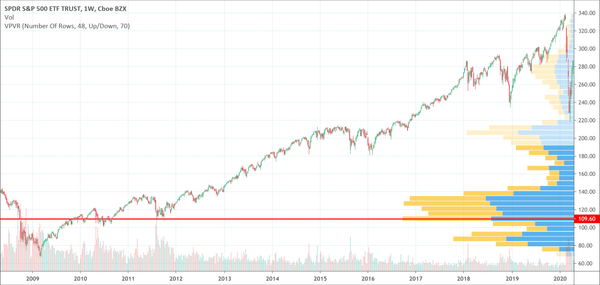
- Volume Profile Zones
- Trendlines and Breakouts
- VWAP
🔗 VWAP Trading Strategy - Relative Volume (RVOL)
🔗 What Is Relative Volume (RVOL)?
Final Thoughts
Hidden divergence gives traders an early signal that a trend is still alive and kicking—even when price appears weak. It’s an edge most traders overlook, but those who learn to recognize it can capitalize on solid entries during pullbacks in a trend.
When paired with solid risk management, trend confirmation, and a proven exit strategy, hidden divergence can help you enter high-probability setups with more confidence.
Helpful External Resources: