EMA vs. SMA: Which Moving Average Should You Use?
Are you confused about whether to use EMA or SMA in your trading plan? Explore this guide to learn all about them!


Trading is super unpredictable at times; however, technical indicators are here to save the day. Whether you are a pro trader or someone who is just testing the waters, moving averages are a great tool that helps you make smooth moves and decisions. It is possible that trying to understand its types becomes perplexing. In this guide, you will find everything you need to know about the types of moving averages and which one to choose when making smart trades.
What is a Moving Average (MA) and how does it work?
Traders are always analyzing market trends and making moves according to these predictions. In doing so, they use multiple indicators that help them make wise decisions to buy and sell. Moving average (MA) is an example of such an indicator, as it smoothens out price shifts occurring during a day. In addition to that, they help create a trend by keeping in check the price.
When you calculate a moving average, it identifies the direction of the trend and evaluates the support and resistance levels of the stock. It is an indicator that shows the trend or lagging, as it is based on the past prices of the assets. Moving average plays a significant role in trades as it mitigates the impact of random and short-term fluctuations of prices, giving stable charts.
Simple Moving Average
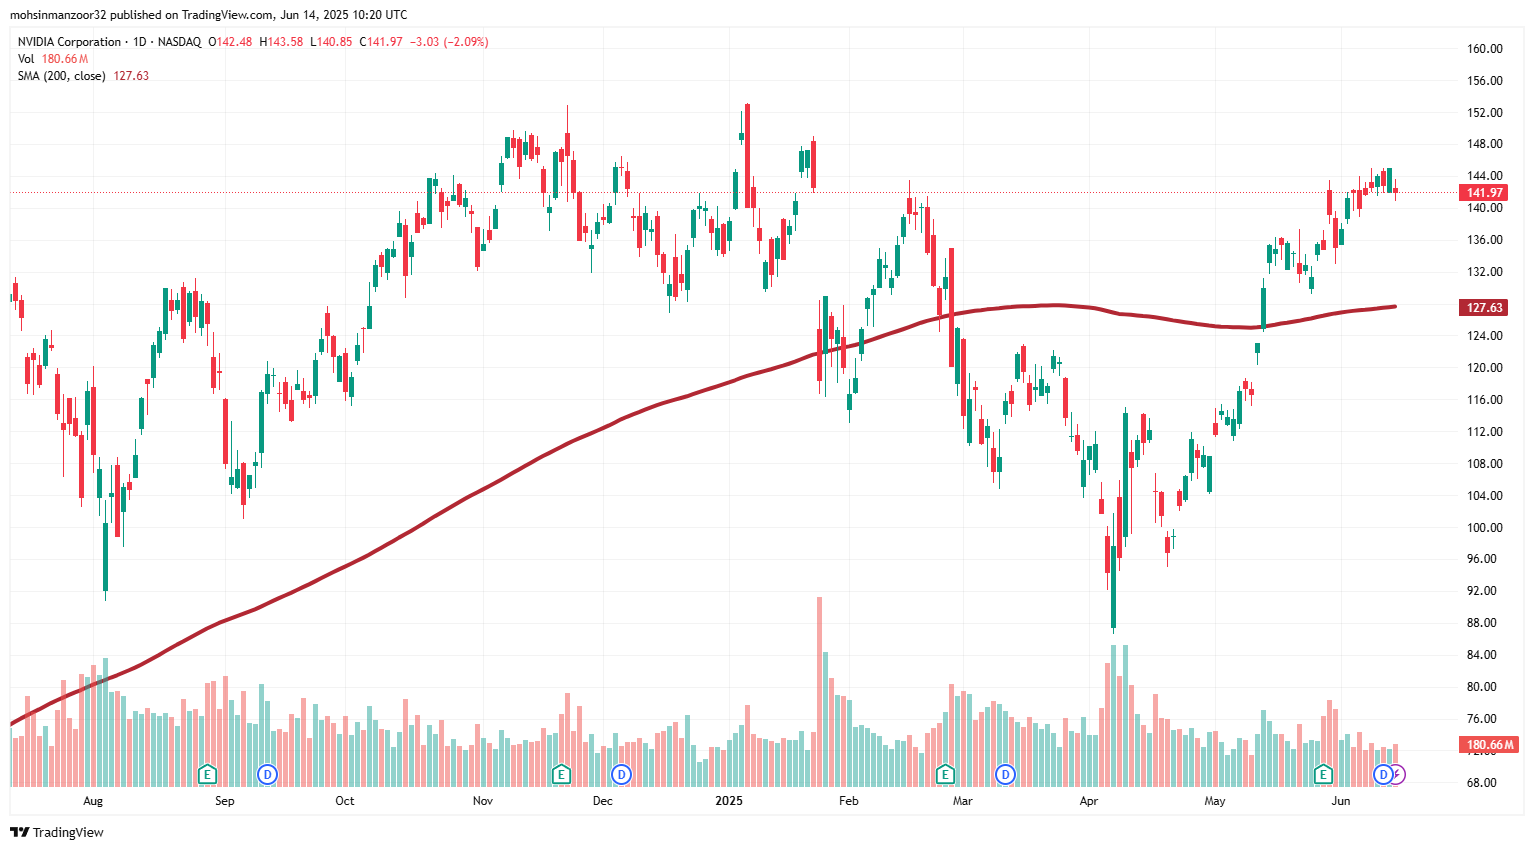
When talking about moving averages, the Simple Moving Average (SMA) is the ultimate type. It is commonly used by analysts and traders and is calculated quite easily. You just have to divide the sum of prices by the total number of prices in the series. For example, if you want to calculate the average of 20 assets, you can add the twenty prices together and divide the result by twenty. That is how you get a simple moving average quickly and without any complex math.
Exponential Moving Average
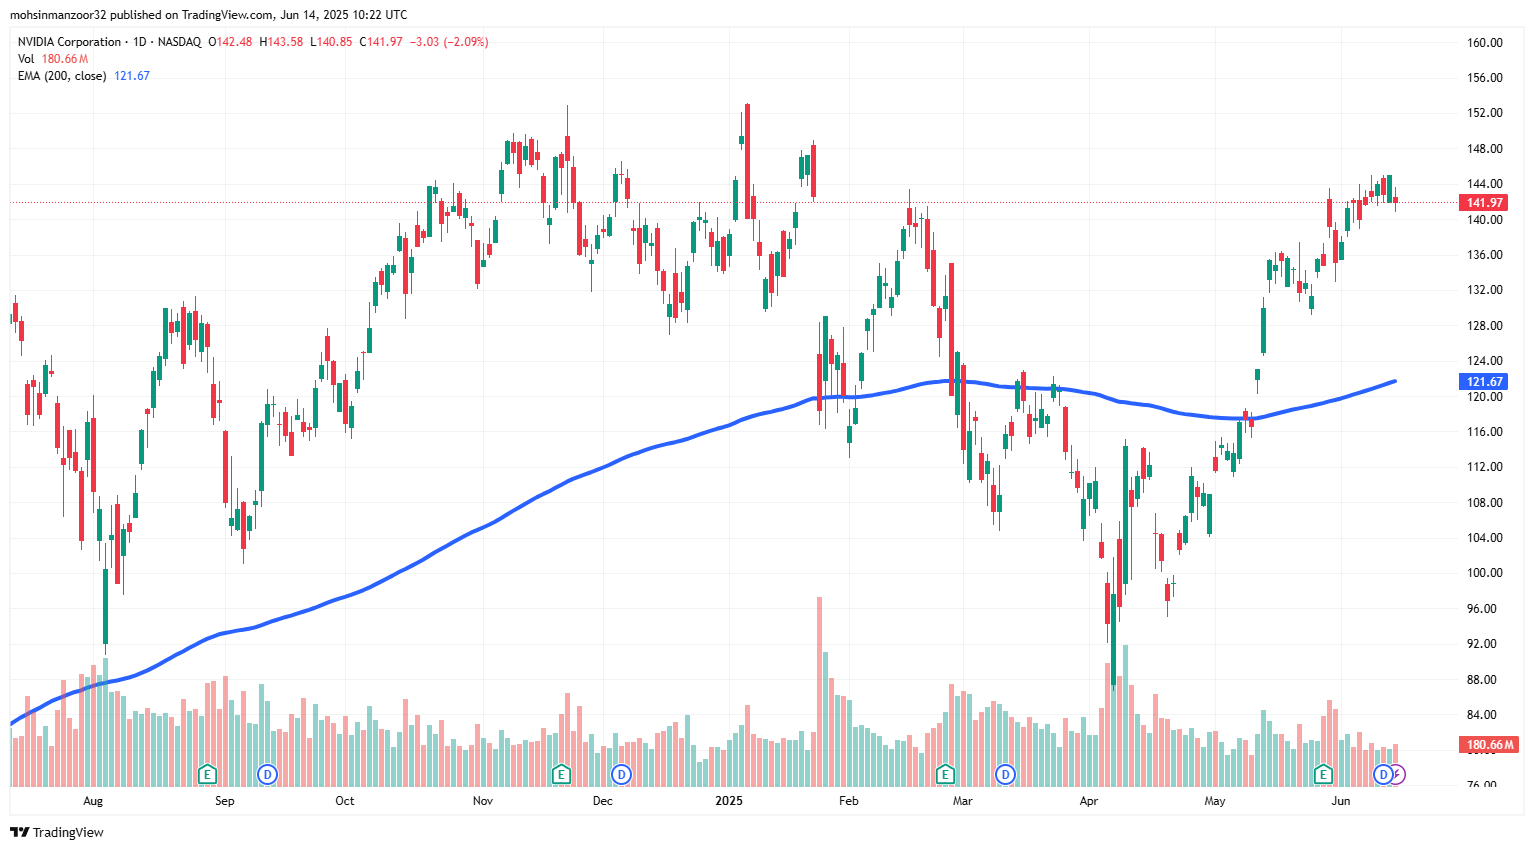
The Exponential Moving Average (EMA) is all about recent data, which is highly sensitive due to the frequent price shifts. The EMAs give timely results that are significantly preferred among traders. EMA can be calculated by using a formula that is slightly complex than SMAs, but you do not have to worry about it, as most trading platforms do it for you. This way, you can put your complete focus on the trade without investing your brain and energy in torturous calculations.
You can have a look at the formula to understand the calculation better. However, there is no need to panic about the calculations, as most trading platforms make it easier for traders to calculate EMA easily and quickly. All you have to do is focus on your investments and stocks!
EMAt =[Vt ×(s/(1+d))]+EMAy ×[1−(s/(1+d))]
where:
EMAt = EMA today
Vt = Value today
EMAy = EMA yesterday
s = Smoothing
d = Number of days
SMA vs. EMA
One of the main differences between SMA and EMA is their calculation methods and how they respond to the price fluctuations. It is like choosing between a tortoise and a hare for your racing team. They both have their strengths, but the way they reach the finish line is totally different. Generally, the thing with moving averages is that they are found to be slower to react to price shifts in longer periods of time. So, choosing SMA or EMA is not that difficult to decide!
EMA is more about recent price changes and is an ideal tool for short-term traders. In addition to that, it tracks price shifts closely and is quick moving with the price trends. However, SMA is likely to be chosen by long-term traders as it provides equal weight to all prices and most importantly shows a smooth chart that eliminates the possibilities of most fakeouts.
The features that make the EMA a good choice for short-term trading also limit its effectiveness with long-term trading. Since the EMA reacts faster to price changes than the SMA, it might tell you to buy or sell when the price is just making small moves, not a real trend. That’s why the EMA might not be the best choice for making decisions on slower charts or trade markets.
Although the SMA is slow and lags but it tends to smooth price trend over time. This makes SMA a good trend indicator. On the contrary, the quick response of the exponential moving average makes it more appropriate for short-term trading. Now, it is really a trader’s choice to decide whether they use SMA or EMA as both have their pros and cons and different conditions.
Choosing the Right Indicator for Your Trading Strategy
There is no right strategy when it comes to trading. You have multiple options and tools to choose from and the great part is you do not need to stick to only one type of MA for your decisions. You can make use of the moving averages by combining them both. This will allow you to make smooth moves in the trade market with better accuracy and professional style.
When to Use EMA
For traders who are always looking out for quick movements and shifts, EMA is just the perfect choice for them. They give spontaneous reactions to price changes, helping you spot short-term trends in the fast-paced markets so you never miss a beat when diving into the trading world.
When to Use SMA
For people who have their eyes on the bigger picture and long-term investment plans, SMA might be the right choice for them. In the SMA, the price changes are quite slow, allowing you to see the overall trend without getting distracted by the short-term price changes and fluctuations.
Also check out How to Use Volume Profile in Day Trading!
Conclusion
To sum it all up, both SMA and EMA have their own characteristics and strengths but it totally depends on your trading approach which one to use. A lot of traders combine them both and create a combination that have a deadly effect on the stocks, skyrocketing the profits. I like to use the 9, 20, 60, and 200 EMA's (give them a try). You just have to understand how the moving averages work and strategize a trading plan. So, equip yourself with the best moving average according to your trading plan and make profits like a pro!