3 Powerful MACD Trading Strategies You Can Use Today
Want to trade smarter with the MACD? This guide breaks down three simple but powerful MACD strategies you can start using today which are perfect for beginners learning how to spot momentum shifts and key price levels.

"The market is a device for transferring money from the impatient to the patient." — Warren Buffett
The MACD is one of the easiest indicators to use and one of the most powerful too. Whether you're trading forex, stocks, or crypto, this tool can help you find smart places to enter and exit trades. In this guide, you’ll learn three simple MACD strategies you can start using right away, even if you’re still new to trading.
Key Takeaways
- MACD gives clues about momentum and trend changes.
- These 3 strategies are beginner-friendly and useful for all markets.
- Knowing where to place stop-loss and take-profit levels is key.
- MACD works best with price action and other support tools.
- Always practice on a demo before trading live.
Strategy 1: MACD Crossover Entries
The MACD crossover is one of the easiest and most popular trading strategies. It's simple enough for beginners to understand and powerful enough that many experienced traders still use it today. This strategy helps you catch the beginning of a trend.
What Is a MACD Crossover?
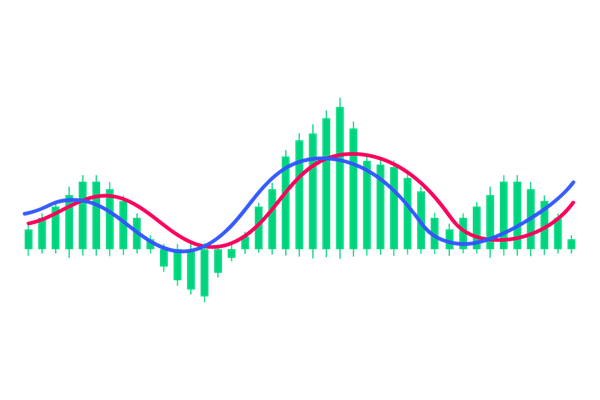
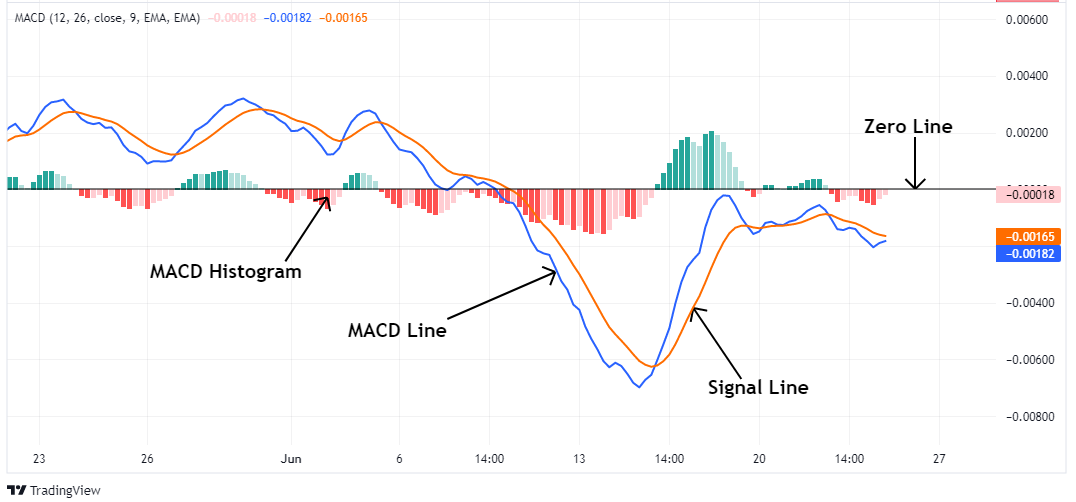
A crossover happens when the two main lines of the MACD indicator which are the MACD line and the Signal line cross over each other.
- The MACD line reacts faster to price changes.
- The Signal line moves more slowly and smooths out the MACD.
When these two lines cross, it signals a possible change in momentum.
How to Read the Signal
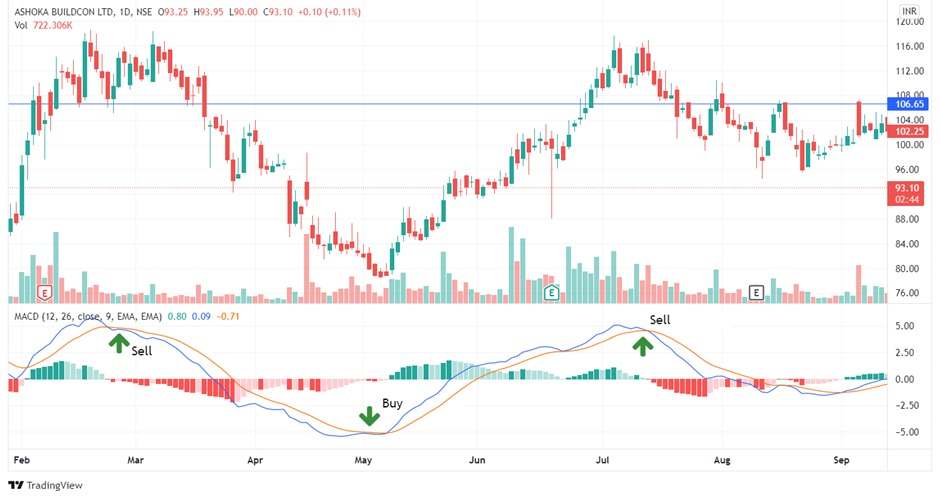
- Bullish Crossover (Buy Signal):
The MACD line crosses above the Signal line. This means buyers are getting stronger, and price might go up. - Bearish Crossover (Sell Signal):
The MACD line crosses below the Signal line. This means sellers are gaining control, and price might go down.
These signals are most useful when they match what price is already doing. For example, if price is making higher highs and the MACD gives a bullish crossover, that supports a buy trade.
Ideal Entry Points
Crossover entries work best:
- At the start of a new trend (right after consolidation or sideways movement)
- Near support (for buys) or resistance (for sells)
- When the crossover happens above or below the zero line, this tells you if the trend is strong or just starting
Example:
Let’s say you’re looking at Apple stock on a 1-hour chart. The MACD line crosses above the Signal line just as price bounces off a support level. That could be a good signal to go long (buy).
Stop-Loss Placement
Never enter a trade without a stop-loss! With MACD crossover trades, you can place your stop:
- Below the recent swing low (if buying)
- Above the recent swing high (if selling)
This keeps your risk small if the signal turns out to be false.
Take-Profit Options
Here are a few ways to set your target:
- Risk-to-Reward Ratio: Go for 1:2 or 1:3 risk/reward. For example, if you risk 20 pips, aim for 40–60 pips in profit.
- Next Key Level: Look at the chart for the next resistance or support zone.
- Opposite Crossover: Exit the trade when the MACD lines cross again in the other direction.
Pro Tip: Use with the Zero Line
- If the crossover happens above the zero line, it usually means the trend is already strong.
- If the crossover happens below the zero line, it may signal an early trend or a reversal forming.
Strategy 2: MACD Divergence for Reversals
Divergence is a powerful signal that shows when price may be running out of strength. When used with the MACD, divergence helps you spot trend reversals early, before the crowd sees it. This makes it a favorite for traders looking to catch major turning points.
What Is Divergence?
Divergence means the MACD indicator and price are moving in opposite directions.
It tells you that the price might be going too far, too fast, and a reversal could happen soon.
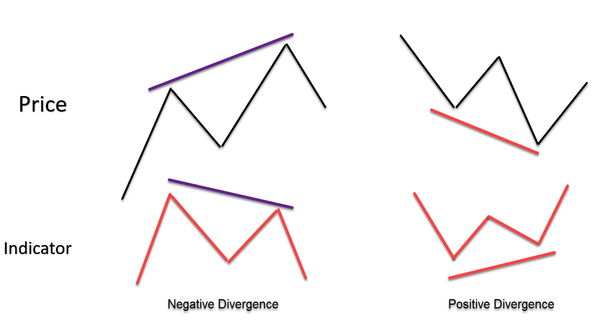
- Bullish Divergence:
Price is making lower lows, but MACD is making higher lows. This means sellers are losing steam, and buyers may step in. - Bearish Divergence:
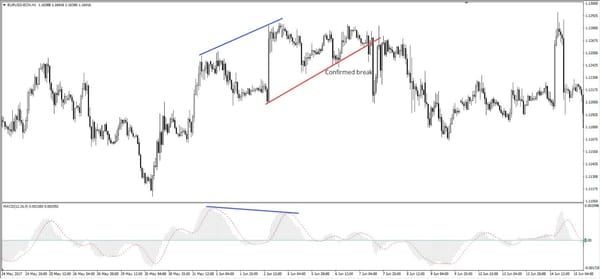
Price is making higher highs, but MACD is making lower highs. This shows the uptrend is weakening, and a drop may follow.
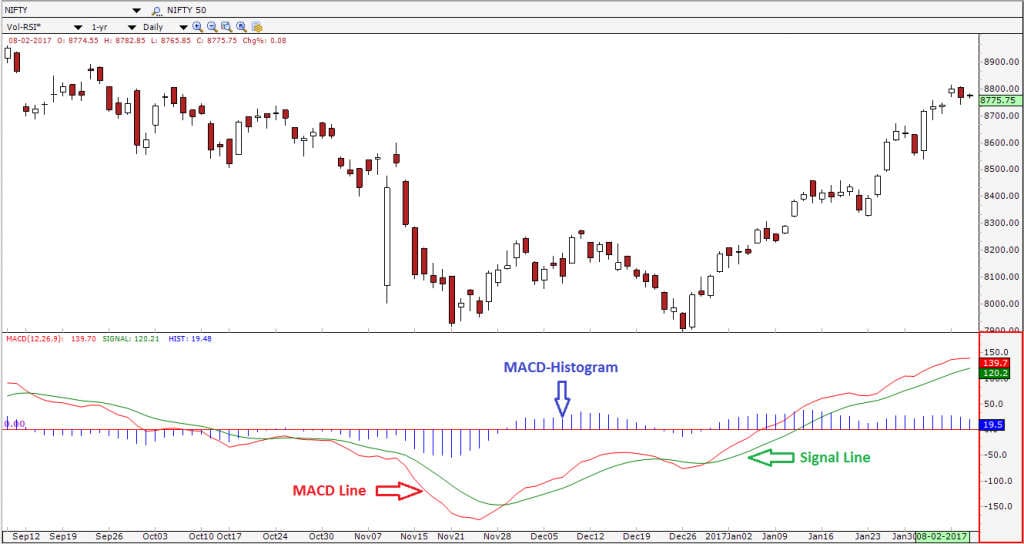
How to Spot Divergence
- Look at Price and MACD Together
Put MACD under your price chart. Compare the peaks and valleys (highs and lows) of both. - Use a Line Tool
Draw trendlines connecting highs or lows on both price and MACD. If they go in opposite directions, you have divergence. - Watch for It at Key Levels
Divergence is stronger near support or resistance zones. If price is at a strong level and divergence appears, it adds extra confidence.
Entry Steps with MACD Divergence
Here’s how to turn divergence into a full trading setup:
- Step 1: Find divergence (bullish or bearish) near a key zone.
- Step 2: Wait for confirmation, like a MACD crossover or a candlestick pattern (like a pin bar or engulfing candle).
- Step 3: Enter the trade in the direction of the expected reversal.
Where to Place Stop-Loss
You want to protect your account from fakeouts. For divergence trades:
- Bullish divergence: Put stop just below the lowest price point (the low that formed the divergence).
- Bearish divergence: Put stop just above the highest price point (the high that formed the divergence).
This keeps your loss small if the price keeps trending.
How to Take Profit
Here are a few options:
- Use a 1:2 or 1:3 risk-to-reward ratio (always aim to win more than you risk).
- Target next support or resistance zone.
- Exit when MACD momentum slows down or a new opposite crossover appears.
Best Timeframes for MACD Divergence
- 1-hour, 4-hour, and daily charts work best. They filter out the noise and give more reliable signals.
- You can spot divergence on smaller timeframes too, but it’s riskier.
Common Mistakes to Avoid
- Entering Too Early
Don’t jump in the moment you see divergence. Wait for confirmation like a price reaction or MACD crossover. - Using Divergence Alone
Divergence is just a clue, not a full trade signal. Always combine it with other tools like price levels or candlestick patterns. - Trading in Strong Trends
Divergence is weaker in trending markets. If a strong trend is in place, divergence might not lead to a big reversal.
Bonus Tip: Use Volume or Support Zones
Divergence becomes even better when volume drops or spikes near the divergence point, or when it happens at a known support/resistance area.
Strategy 3: MACD + Support and Resistance Zones
The MACD indicator becomes much more powerful when you combine it with support and resistance levels. These price zones show where traders have bought or sold a lot in the past. When MACD gives a signal at these areas, it can help confirm a high-probability trade setup.
What Are Support and Resistance Zones?
- Support is a price level where buyers often step in and push the price up.
- Resistance is a level where sellers usually enter and push the price down.
These zones act like invisible walls on the chart where price reacts either by bouncing back or breaking through.
Why Combine MACD with Support/Resistance?
The MACD tells you when momentum is shifting, while support and resistance show you where those shifts are likely to happen.
This combo works because:
- Support/resistance gives you the location (where to look)
- MACD gives you the timing (when to act)
This reduces guesswork and helps you avoid entering too early or too late.
How to Trade the Setup
Step 1: Mark Key Zones
Look at your chart and draw horizontal lines where price has turned before. These are your support and resistance levels.
Step 2: Wait for Price to Reach a Zone
Be patient. You don’t want to enter randomly. Only act when price approaches one of these levels.
Step 3: Check MACD for a Signal
Now look at your MACD:
- A bullish crossover near support suggests a possible bounce.
- A bearish crossover near resistance hints at a reversal downward.
If price also forms a candlestick signal (like a pin bar or engulfing candle), that’s even better.
Example Setup:
Let’s say the EUR/USD is falling toward a known support zone from last week. As price reaches that level, the MACD line crosses above the signal line (bullish crossover). That could be a buy signal.
You could:
- Enter a long trade as soon as the crossover is confirmed
- Place a stop-loss just below the support zone
- Set your take-profit at the next resistance level or based on a 1:2 risk/reward plan
Stop-Loss Placement
Good stop-loss placement keeps your losses small if the market doesn’t go your way.
- For buy trades, place the stop just below the support zone.
- For sell trades, place the stop just above the resistance zone.
Avoid putting stops right on the level—give it a little space to avoid being hit by noise or fakeouts.
Take-Profit Ideas
You can set your target in several ways:
- The next support/resistance level on the chart
- A fixed risk/reward ratio (like 1:2 or 1:3)
- Exit when MACD crosses in the opposite direction
Use what fits your style and the market’s behavior.
When This Strategy Works Best
This MACD + Support/Resistance combo works best:
- In ranging or sideways markets, where price bounces between zones
- After a sharp move, when the market is looking to retest old levels
- On higher timeframes, like the 1-hour, 4-hour, or daily chart
It may be less useful during strong trends unless you're using it for pullback entries.
Common Mistakes to Avoid
- Forcing trades when price isn’t near a zone
Wait for price to come to you. Don’t try to guess tops or bottoms. - Ignoring confirmation
Don’t trade just because price touches a line. Always check MACD and price action for clues. - Trading too close to major news events
News can break through any level. Be cautious if big economic data is about to release.
Pro Tip: Zoom Out
Always zoom out and check the bigger picture. Support/resistance zones on higher timeframes (like daily or weekly) are stronger and more reliable. Use MACD signals from shorter timeframes within those bigger zones for better accuracy.

Comparison Table of MACD Strategies
|
Strategy |
Best For |
Signal Type |
Extra Confirmation Needed |
|
MACD Crossover |
Trend Following |
Entry & Exit |
No, but helps |
|
MACD Divergence |
Trend Reversal |
Warning Sign |
Yes (price action, S/R) |
|
MACD + Support/Resistance |
High-Probability Entry |
Entry Confirmation |
Yes (zone or candle setup) |
Conclusion
These three MACD strategies are simple, yet powerful. Whether you’re trading part-time or just getting started, adding MACD to your chart can help you spot better trades. Always test your strategy on a demo account and combine MACD with other tools for stronger results.
FAQs
1. Which MACD strategy is best for beginners?
The crossover strategy is the simplest to start with. It's easy to spot and works well in trending markets.
2. How do I avoid fake MACD signals?
Use other tools like support/resistance or candlestick patterns to confirm your MACD signal.
3. Can I use these MACD strategies on all timeframes?
Yes, but longer timeframes like 1-hour or 4-hour give more reliable signals than 1-minute or 5-minute charts.
4. Should I change MACD settings for these strategies?
You can use the default settings (12, 26, 9). Test different ones only after you’re comfortable.
5. Do I need other indicators with MACD?
Not always, but tools like RSI or moving averages can give extra confirmation for smarter decisions.